Statistics Definitions > Q-Value
You may want to read these articles first:
What is a False Discovery Rate?
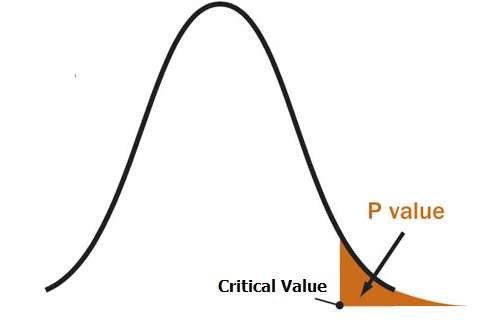
What is a P-Value?
What is a Q-Value?
Why are Q-Values Necessary?
Usually, you decide ahead of time the level of false positives you’re willing to accept: under 5% is the norm. This means that you run the risk of getting a false statistically significant result 5% of the time. You can’t escape this fact when you’re running tests: false positives (p-values) are a fact of life and are unavoidable. While 5% might be an acceptable false positive rate for running one test, it becomes completely unacceptable if you run thousands of tests on the same small data set. Here’s why:
Imagine you’re planning scratch off lottery, and you have a 5% chance of getting a winning ticket. One ticket gives you a 5% chance, but if you buy enough tickets, probability tells us that you’ll eventually get a winner (buying 1,000 lottery tickets should do the trick and will in fact give you, on average, 50 winning tickets). The same is true for lab tests.
- The first test on your data, you have a 5% chance of a false positive.
- The second test on your data, you have another 5% chance of a false positive.
- The thousandth test on your data, you have had a 5% chance of a false positive a thousand times.
Essentially, you’ll get a false positive — a false “significant” result — if you run enough tests. In fact, at a 5% FDR, you’ll get 5 false results for every 100 tests you run, or 50 for every thousand. That’s pretty high. This is called the multiple testing problem.
The False Discovery Rate approach to p-values assigns an adjusted p-value for each test. This is the “q-value.” A p-value of 5% means that 5% of all tests will result in false positives. A q-value of 5% means that 5% of significant results will result in false positives. Q-values usually result in much smaller numbers of false positives, although this isn’t always the case..
To put this another way, p-values tell you the percentage of false positives to expect and take into account the number of tests being run. For example, if you run 1600 tests, you would expect to see about 80 false positives. The q-value doesn’t take into account all the tests; they only take into account the tests that are below a threshold that you choose (i.e. tests reporting a q-value of 5% or less).
Note: The Q-value is not the same as the “Q” you sometimes see in statistics. Q on its own (as opposed to a Q-value) refers to elements in a set that don’t have a particular attribute. For example, let’s say you had 100 people and 57 of them like pizza. The proportion of people who like pizza is P=0.57. Therefore, Q = 0.43 (which is just 1 – P).
Reference:
P and q values in RNA Seq.