A production function shows the relationship between inputs like capital and labor and outputs like goods and services [1]. It can be useful for optimizing the maximum amount of goods that can be produced using various combinations of inputs.
The economy’s production function is usually stated as [2]:
Y = A·F(K, N)
Where:
- Y = real GDP
- A = overall productivity index
- K = capital input (in monetary value, land or other physical units)
- N = number of employed workers (skilled, unskilled)
Variations of the Production Function Formula
There are many variations on the basic formula. They include [3]:
Y = zF(K, Nd)
- Y = output of consumption goods.
- z = total factor productivity.
Or [5]:
Q = F(K, L).
- Q = quantity / output.
- K = capital input.
- K = labor input.
- F = functional form relating inputs to output.
The right hand side of this particular equation “F()” is sometimes called “the production function” as it is the part of the equation that actually produces the result.
The following video is an overview of a specific type called the Cobb-Douglas Production Function:

The marginal product is the additional amount of goods that can be produced by varying one input while holding others constant. For example, you might hold capital constant while varying the number of workers.
Graph of The Production Function
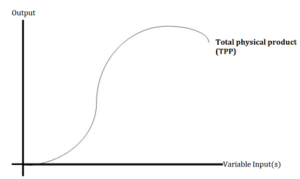
This graph shows how various changes in inputs, like labor and capital, affect the output of total goods. Each (x, y) point on the graph is a different combination of these variable inputs. As more variable inputs are combined with fixed quantities of other inputs, output will reach a point of decline, a concept called diminishing marginal productivity [5].
References
[1] McGahagan, T. (1997). Production Functions. Retrieved April 5, 2021 from: http://www.pitt.edu/~mgahagan/Prodfn.htm
[2] Production Function. Retrieved April 5, 2021 from: https://faculty.washington.edu/ezivot/econ301/production_function.htm
[3] Bairoliya, N. (2004). ECON3102-005 Chapter 4: Firm Behavior. https://scholar.harvard.edu/files/nbairoliya/files/lec05.pdf
[4] McGraw-Hill Companies. (2010). Chapter 5: The Production Process and Costs. http://home.ubalt.edu/NTSBSAWH/ECON305_PPT/Chap005.pdf
[5] Production Function and Stages of Production — Applying the Concept of Diminishing Marginal Productivity. Retrieved April 5, 2021 from: https://www.ag.ndsu.edu/aglawandmanagement/agmgmt/coursematerials/productiontheory/productionfunction
Fantastic