Correlation Coefficients >
Point Biserial Correlation
Contents:
1. What is Point Biserial Correlation?
The point biserial correlation coefficient, rpbi, is a special case of Pearson’s correlation coefficient. It measures the relationship between two variables:
- One continuous variable (must be ratio scale or interval scale).
- One naturally binary variable.*
Many different situations call for analyzing a link between a binary variable and a continuous variable. For example:
- Does Drug A or Drug B improve depression?
- Are women or men likely to earn more as nurses?
Formula
The formula for the point biserial correlation coefficient is:
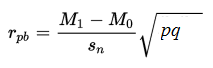
- M1 = mean (for the entire test) of the group that received the positive binary variable (i.e. the “1”).
- M0 = mean (for the entire test) of the group that received the negative binary variable (i.e. the “0”).
- Sn = standard deviation for the entire test.
- p = Proportion of cases in the “0” group.
- q = Proportion of cases in the “1” group.
Most people won’t work this formula by hand as most statistical software packages can calculate the coefficient for you.
Interpretation
Like other correlation coefficients, the point biserial ranges from 0 to 1, where 0 is no relationship and 1 is a perfect relationship.

Cautions:
- *If you intentionally force data to become binary so that you can run point biserial correlation, perhaps by splitting continuous ratio variables into two segments, it will make your results less reliable. There are exceptions to this rule of thumb. For example, you could separate test scores or GPAs into pass/fail, creating a logical binary variable. An example unnaturally forcing a scale into a binary variable: saying that people under 5’9″ are “Short” and over 5’9″ are “tall.”
- One assumption for this test is that the variables are randomly independent. Therefore, the point biserial shouldn’t be used to analyze experimental results; use Linear Regression with dummy variables instead.
2. Biserial Correlation
Biserial correlation is almost the same as point biserial correlation, but one of the variables is dichotomous ordinal data and has an underlying continuity. For example, depression level can be measured on a continuous scale, but can be classified dichotomously as high/low.
The formula is:
rb = [(Y1 – Y0) * (pq/Y) ] /σy,
Where:
- Y0 = mean score for data pairs for x=0,
- Y1 = mean score for data pairs for x=1,
- q = proportion of data pairs for x=0,
- p = proportion of data pairs for x=1,
- σy = population standard deviation.
Y is the height of the standard normal distribution at z, where P(z'<z) = q and P(z’>z) = p.
If you know the point-biserial correlation, you can also find biserial correlation with the following formula (Sheskin, 2011):
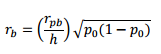
Where:
![]()
Pr[Z ≥u|Z~N(0,1)] = p1.
References:
Sheskin, D. (2011). Handbook of Parametric and Non PArametric Statistical Procedure (5th ed.). Boca Raton, FL: CRC Press.