What is a Sign Diagram?
A sign diagram shows you where a function has positive or negative values.
How to make a sign diagram: General Steps [1]
- Find the critical points. These will be anywhere the function has zeros(roots) or vertical asymptotes.
- Figure out if your points in Step 1 are zeros, vertical asymptotes or holes.
- Test a point in each interval to see if it is positive or negative in that interval.
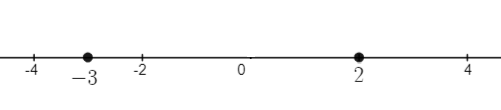
- Draw a number line with the critical points. Label each point underneath with its x-value.
- Ad a ± in each interval, indicating where the function is positive or negative (or note that it is undefined).
How to Make a Sign Diagram: Example
Example question: Make a sign diagram of the following function:
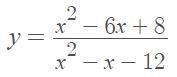
Step 1: Find the critical points. In order to find the critical points for this particular function, we need to factor it:
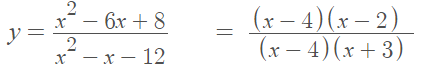
The function has three critical values: one which will make the function equal zero (x = 2) and two which make the function undefined (x = -3).
Step 2: Figure out what’s happening at the critical points. You can do this by plugging in some values into the equation for the function:
- x = -3 is a vertical asymptote. You can check for this by testing a few values around x = -3; They will start to deviate rapidly.
- x = 2 is a zero(root). This is where the function crosses the x-axis. Plug x = 2 into the function and y = 0.
- x = 4 is a hole. If you plug x = 4 into the function, it will be undefined.
The point at x = 4 is a hole and does not change the sign of the function, so we can omit it from our sign diagram.
Step 3: Draw a number line with the points from Step 3 (usual practice is to place the labels underneath the line):
Step 4: Test a random point in each interval. For this sign diagram, we have three intervals:
- (-∞, -3)
- (-3, 2)
- (2, ∞}
At this point, you could refer to the graph. But if you aren’t able to graph the function, test a point by plugging it into the function. For example, in the middle interval you might choose 0:
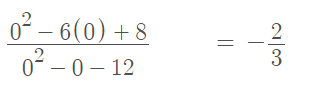
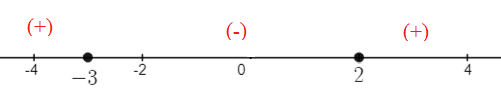
This is a negative value, so the sign on the center interval will be negative.
Step 5: Complete the sign diagram by placing a “-” or “+” in each interval, based on your results from Step 4.
References
[1] How to Construct a Sign Diagram: Retrieved July 13, 2021 from: https://people.highline.edu/dwilson/Previous_Classes/2006.4_Fall/2006_fall_math_115/sign_diagrams/how_to.htm
[2] Smith, K. (2013). Elementary Functions. Retrieved July 13, 2021 from: https://www.shsu.edu/kws006/precalculus/2.6_Rational_Functions_files/2.6%20Rational%20Functions%20(slides,%204%20to%201).pdf