A frequency in statistics is the number of times an event or observation happened in an experiment or study. It can also be defined simply as a count of a certain event.
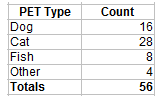
For example, you might conduct a survey of pet owners to see how many people owned certain kinds of pets. If 16 people responded that they owned a dog, then 16 is the frequency (the count of the number of people who own dogs). It’s often easier to understand your results if you create a graph or table such as a frequency chart.
Types of Frequency in Statistics
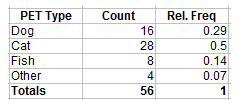
In addition to simple counts, frequencies can get more complex. For example, you might want to know what percentage of people owned dogs. In the pet ownership survey, 16 out of 56 people responded that they owned dogs. As a percentage, that’s:
16 / 56 = 29% (or, .29 as a decimal).
This is called a relative frequency in statistics; it is a count of something compared to a whole (the “whole” in this case is the 56 people who responded to the survey). You can expand your regular frequency chart to include a third column for these relative frequencies:
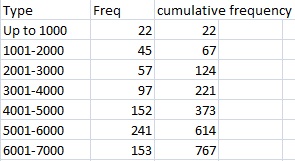
A cumulative frequency distribution shows a running total of all preceding frequencies in a frequency distribution. Cumulative frequencies can help you find totals for cut off points. For example, let’s say you conducted a survey of factory incidents per year. Anything below 4,000 is considered satisfactory, so you want to know how many factories were below that limit. The following table shows that 221 factories reported 4,000 or fewer “incidents”: