Excel for Statistics > Standard Error Excel
Watch the short video to learn how to find standard error Excel or read the steps below:
Standard Error Excel: Overview
The standard error is really just another name for the standard deviation. In fact, where the standard deviation is a term used for a population, standard error is the term for a standard deviation for a sample. Standard deviation is a parameter, and standard error is a statistic (How to tell the difference between a statistic and a parameter). It’s an approximation of the true standard deviation.
There isn’t a formula that you can use to find standard error Excel 2013. You could manually type the formula into a cell. The formula for standard error = standard deviation / sqrt(n), where “n” is the number of items in your data set. A much easier way is to use the Data Analysis Toolpak (How to load the Data Analysis Toolpak).
If you want to type the formula in manually you would have to calculate the standard deviation first (using the stdev function), so it’s less hassle just to use Data Analysis. Once you’ve installed the Toolpak, you’re given plenty of statistical functions. Those are available in a click or two. No having to memorize a list of Excel formulas!
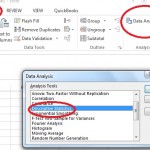
Step 1: Click the “Data” tab and then click “Data Analysis.”
Step 2: Click “Descriptive Statistics” and then click “OK.”
Step 3: Click the Input Range box and then type the location for your data. For example, if you typed your data into cells A1 to A10, type “A1:A10” into that box
Step 4: Click the radio button for Rows or Columns, depending on how your data is laid out.
Step 5: Click the “Labels in first row” box if your data has column headers.
Step 6: Click the “Descriptive Statistics” check box.

Step 7: Select a location for your output. For example, click the “New Worksheet” radio button.
Step 8: Click “OK” to display descriptive statistics, which includes the standard error.
That’s it!