Charts and Graphs > > Causal Graph
What is a Causal Graph Model?
A causal graph model (also called Bayesian networks, DAGs or path diagrams) are a way to represent how causality works in terms of what causes what. These probabilistic graphical models are used to encode assumptions about data-generating processes.
Independence and conditional independence are central to causal inference. Yet, it can be pretty challenging to wrap our heads around them. But this can change if we use the correct language to describe this problem. Here is where causal graph models come in.
How Causal Graph Models Work
Causal graphical models use arrows to show the direction of causality between variables. The direction of the arrow shows which variable is the cause and which is the effect. For example, in the graph below, we can see that C causes D.

We can also see from this graph that there is no causal relationship between f1 and f2. We would say that f1 and f2 are independent. In other words, f1 does not affect f2 and vice versa. If the arrow pointing from f1 to f2 is crossed out, there is no relationship between these two variables.
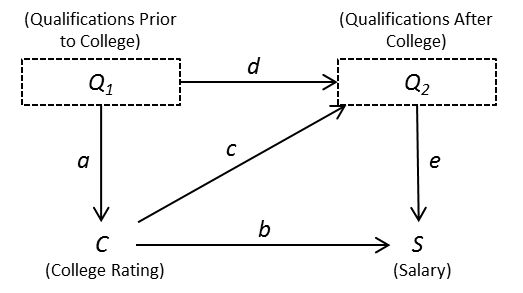
Now let’s take a look at a more complicated example of a causal graph. In the graph below, we can see that Q1 causes Q2 and that Q2 causes c.
In conclusion, causal graphical models provide a helpful way to visualize how causality works by representing relationships between variables using arrows. These models can be used to help understand both direct and indirect relationships between variables, as well as relationships where there is no causality whatsoever. By understanding how these models work, we can gain a better understanding of how causality works in general.
References
Images: Comments? Need to post a correction? Please Contact Us.
Brrryant, CC BY-SA 4.0 , via Wikimedia Commons
Sophivorus, CC BY-SA 4.0