Regression Analysis > Residual Plot
What is a Residual Plot?
Watch the video for an overview and several residual plot examples:

Can’t see the video? Click here to watch it on YouTube.
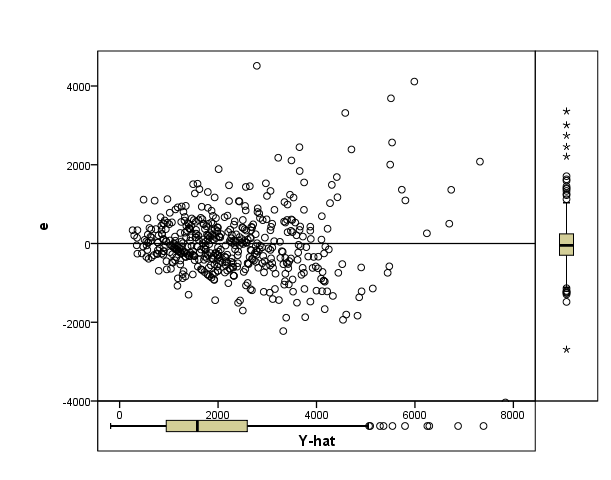
A residual value is a measure of how much a regression line vertically misses a data point. Regression lines are the best fit of a set of data. You can think of the lines as averages; a few data points will fit the line and others will miss. A residual plot has the Residual Values on the vertical axis; the horizontal axis displays the independent variable.

A residual plot is typically used to find problems with regression. Some data sets are not good candidates for regression, including:
- Heteroscedastic data (points at widely varying distances from the line).
- Data that is non-linearly associated.
- Data sets with outliers.
These problems are more easily seen with a residual plot than by looking at a plot of the original data set. Ideally, residual values should be equally and randomly spaced around the horizontal axis.
Examples
If your plot looks like any of the following images, then your data set is probably not a good fit for regression.

The residual plot itself doesn’t have a predictive value (it isn’t a regression line), so if you look at your plot of residuals and you can predict residual values that aren’t showing, that’s a sign you need to rethink your model. For example, in the image above, the quadratic function enables you to predict where other data points might fall. For a residual plot, that’s not a good thing. If your plot indicates a problem, there can be several reasons why regression isn’t suitable. It doesn’t always mean throwing out your model completely, it could be something simple, like:
- Missing higher-order variable terms that explain a non-linear pattern.
- Missing interaction between terms in your existing model.
- Missing variables.
Residual Plot: References
Beyer, W. H. CRC Standard Mathematical Tables, 31st ed. Boca Raton, FL: CRC Press, pp. 536 and 571, 2002.
Agresti A. (1990) Categorical Data Analysis. John Wiley and Sons, New York.
Klein, G. (2013). The Cartoon Introduction to Statistics. Hill & Wamg.
Vogt, W.P. (2005). Dictionary of Statistics & Methodology: A Nontechnical Guide for the Social Sciences. SAGE.