Contents:
Nonlinearity
Additivity
Nonlinearity
A nonlinearity is a relation between data points that can’t be condensed into a neat linear graph.
Nonlinearity vs. Linearity
To understand nonlinearity we first need to define what it means for relationship between two variables to be linear.
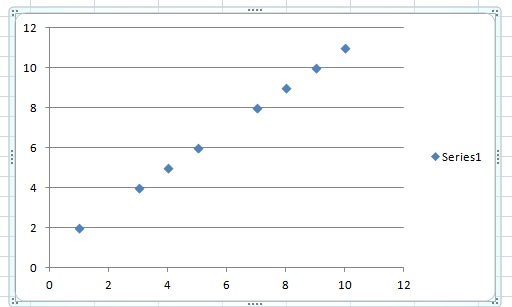
Linearity is easiest to understand visually. If your data is linear, you can graph it on a line plot, like the one above. With allowance for an error term, you’ll be able to draw a neat line through your points.
A small change in your independent variable (input) will lead to a small change in your dependent variable (output). A large change in your independent variable will lead to a large change in your dependent variable. We call this proportionality.
Additivity
The other key property of linear functions is additivity: : f(x + y) = f(x) + f(y). This basically means that you can:
- Superimpose the different contributions to your independent variable (input) with simple adding.
- Split up your output to reflect what parts of the output depends on which different parts of the input.
- Break up your problem to analyze it, using the basic principles of addition and subtraction.
Nonlinearities: When the Rules Change
If additivity and proportionality characterize linearity, nonlinearities are deviations from at least one of those two things. Let the relationship between your variable break either the proportionality rule or additivity principles and you have a nonlinearity.
Small input changes might lead to large output changes, and large input changes to small output changes. Or you might not be able to separate out parts of your input (independent variable) and output for analysis.
Nonlinear systems might be chaotic, or they might simply need a more complicated model than a basic line plot.
Examples of Nonlinearities in Science and Statistics
Fluid turbulence, combustion, and the biochemical reactions that occur in living organisms are just a few examples of the many systems we research today that exhibit nonlinearities.
In statistics, nonlinear regression is a way of finding a nonlinear approximation for data that doesn’t fit the traditional linear analysis. (See below)
Linear and Nonlinear Regression Models
Identifying linear and nonlinear regression models is not quite as easy as looking for straight lines, because linear regression models may include curves. Basically, a linear regression model is defined as a curve that can be written as a sum of a constant and first order parameters multiplied by variables.
Y = a0 + b1 X1 + b2 X2 + b3 X3…
To be a linear regression model, the parameters (b1, b2, b3must each be first order. But the variables (X1, X2, X3) may be squared, cubed, or raised to the nth power, so this could actually be the equation of a curve. You could even take the log or inverse of the independent variable, and this would not affect the linearity of the regression model if the parameters are linear (first order).
If your regression model can’t be written Y = a0 + b1 X1 + b2 X2 + b3X3… , it is a nonlinear model.