Regression Analysis > Chow Test
What is a Chow Test
The Chow test tells you if the regression coefficients are different for split data sets. Basically, it tests whether one regression line or two separate regression lines best fit a split set of data.
Split Data Sets and the Chow Test
Sometimes your data will have a break point or structural point (a period of significant or violent change), splitting a data set into two parts. For example:
- Donations given to an organization before and after a natural disaster.
- Stock market prices before and after Black Friday.
- House prices before and after a significant interest change.
- Asset prices before and after civil war.
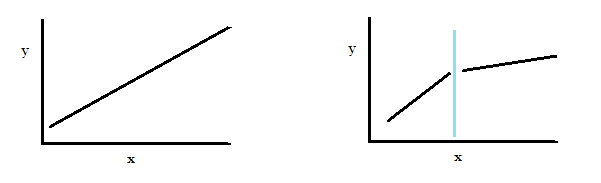
If the two parts can be represented by one single regression line, we say that the regression can be “pooled.”
Let’s say your linear regression analysis of two parts of a data set (shown on the right) resulted in the following two linear regression equations:
- First part of the data: yt = X1*b1 + μ1
- Second part of the data: yt = X2*b2 + μ2
The Chow test would tell you if the coefficients b1 = b2 and μ
Running the Test
The null hypothesis for the test is that there is no break point (i.e. that the data set can be represented with a single regression line).
- Run a regression for the entire data set (the “pooled regression”). Collect the error Sum of Squares data.
- Run separate regressions on each half of the data set. Collect the Error Sum of Squares data for the two regressions.
- Calculate the Chow F statistic using the SSE from each subsample. The formula is:
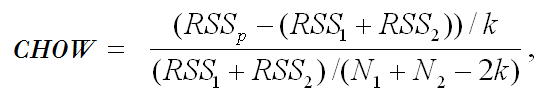
where:- RSSp = pooled (combined) regression line.
- RSS1 = regression line before break.
- RSS2 = regression line after break.
- Find the F-critical value from the F-table.
- Reject the null hypothesis if your calculated F-value falls into the rejection region (i.e. if the calculated F-value is greater than the F-critical value).
Reference:
Chow, G.C. (1960), “Tests of Equality between Sets of Coefficients in Two Linear Regressions,” Econometrica, 28, 591-605.