Hypothesis Testing > Sequential Probability Ratio Test
You may want to read these articles first:
What is a Sequential Probability Ratio Test?
A sequential probability ratio test (SPRT) is a hypothesis test for sequential samples.
Sequential sampling works in a very non-traditional way; instead of a fixed sample size, you choose one item (or a few) at a time, and then test your hypothesis. You can either:
- Reject the null hypothesis (H0) in favor of the alternate hypothesis (H1) and stop,
- Keep the null hypothesis and stop,
- Fail to reach either conclusion and continue sampling.
If you fail to reach a conclusion, you repeat the sampling and then the hypothesis test. You keep on repeating this process until you have a sound conclusion, so you don’t know the how big your sample will be until you’re finished testing.
About the SPRT
Sequential analysis hypothesis testing generally enables a researcher to come to a conclusion with a minimum amount of data. With Wald’s SPRT, the amount of data points required to come to a conclusion can be defined by a random variable, called the sample number Ns. The boundary of the decision region depends on the expected value of this random variable, called the Average Sample Number (ASN). The ASN for the SPRT is lower than all other sequential tests and is usually lower than traditional, fixed-size sampling methods.
 SPRT is based on the likelihood ratio statistic λn. Likelihood ratio tests are extremely difficult to perform by hand, and so software is necessary. However, you do need to specify some conditions, including two constants, A and B (where A > B). These define the conditions under which the null hypothesis will be rejected or not:
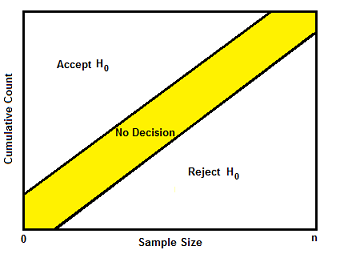
- Accept H0: λ(n) ≤ B
- No conclusion (resample): B ≤ λ(n) < A
- Reject the null hypothesis in favor of H1: λ(n) ≥ A
These three conditions are represented as decision regions (accept/no decision/reject) in the above image.
A and B are relatively simple to calculate with the following formulas:
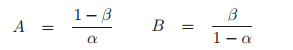
Where:
- α is the alpha level for the test,
- Β is the beta level for the test.
Disadvantages
A major issue with the SPRT is that the optimality of the test only applies to simple hypotheses (e.g. H0 < 10; H1 ≥ 10).
Unless an upper bound is specified, the ASN can become much larger than the amount of data available. A modified SPRT, called the Truncated Sequential Probability Ratio Test (TSPRT), addresses this issue. The test is the same, except a decision is made at a certain maximum sample size. The ASN can also be large if there is a mismatch between the data and the H0 and H1 models.