Descriptive Statistics: Charts and Graphs >
Ribbon diagrams are also known as Richardson diagrams, after Jane S. Richardson who pioneered the concept and hand-drew the first prototypes for an 1981 article in the journal Advances in Protein Chemistry. Today ribbon diagrams are almost always computer-generated.
Ribbon Diagram vs. Ball-and-Stick Model
Ribbon diagrams have an advantage over the other commonly used method of representing protein structures—ball-and-stick models—because the tertiary structure of the molecule is easier to trace.
It’s also easier to recognize α-helices and β-sheets in ribbon diagrams, and if more details are needed these can be added in with superimposed ball-and-stick illustrations. Therefore, a ribbon diagram with ball-and-stick details offers the best of both worlds.
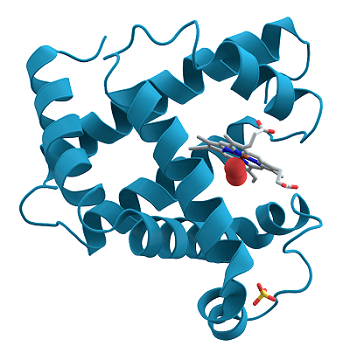
Main Features of Ribbon Diagrams
In a ribbon diagram, the polypeptide backbone is drawn as a smooth curve. Arrows are usually drawn in to show the direction of the polypeptide chain. α-helices are shown as cylindrical spiral ribbons, where ribbon plane will follow, approximately, the plane of the peptides. β-strands are arrows with thickness, usually drawn a quarter as thick as they are wide. These show both the direction and twist of the strand, starting at the amino and finishing at the carboxyl end. Molecular loops are represented as round ropes.
Programs Used to Generate Ribbon Diagrams
Historically the most popular program used to generate ribbon diagrams has been Molscript. It is an open source program which can generate both schematic and more detailed representations, and provides output in a variety of formats: PostScript, Raster3D, VRML 2.0, interactive OpenGL, SGI (aka RGB), JPEG, EPS, PNG, and GIF.
Alternative programs include UCSF Chimera, which bills itself as an ‘extensible molecule modeling system’ and is also free to download for academic, government, non-profit and personal use. It can generate both static pictures and animations.
References
Padlan, Eduardo. X-Ray Crystallography of Antibodies. Advances in Protein Chemistry, Vol 49, 1996, Pages 57-133. Retrieved from https://www.sciencedirect.com/science/article/pii/S006532330860488X March 29, 2018
Basgall, Monte. Ribbon Diagrams.
Retrieved from https://research.duke.edu/ribbon-diagrams on March 29, 2018