Probability and Statistics > Microsoft Excel for Statistics > Cumulative Frequency Table in Excel
In order to follow this article, you should know how to create a regular distribution table/histogram in Excel. Don’t know how? Check out this video/article first: How to Make a Frequency Distribution Table in Excel.
How to Make a Cumulative Frequency Table in Excel: Steps
Step 1: Create a regular frequency distribution table in an Excel worksheet (see: How to Make a Frequency Distribution Table in Excel.)
Step 2: Add a third column to your frequency chart. Title it “Cumulative Frequency.”
Step 3: Type the formula “=B2” (where B2 is the actual location of your first frequency count) in the first row of your new column.
Step 4: Type the formula “=C2+B3” (where C2 is the actual location of your first cumulative frequency count from Step 3, and B3 is the location of your second frequency count) in the first row of your new column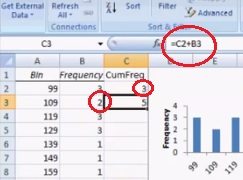 .
.
If this step sounds a little confusing (why add one cell from each column instead of adding down the row?), that’s because you’re setting up Excel to enter formulas automatically. Follow along the next step and you’ll see why the formula is set up that way.
Step 5: Click the cell you entered the formula in Step 4. Click and drag the little black square in the bottom right hand corner of the cell to the bottom of the column. Excel will populate the cell with all of the remaining values.
That’s it!
Check out our YouTube channel for hundreds more statistics videos!