What is a Collider Variable?
Graphically, a node on a causal graph (a type of directed acyclic graph) is a collider variable if the path entering and exiting the node both have arrows pointing into it. Essentially, the paths “collide.”
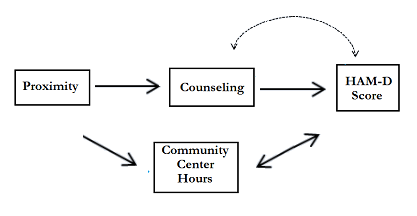
Nodes that don’t meet this definition are called noncolliders. It’s possible for a node to be a collider on one path and a noncollider on a different path on the same graph. If a path has a collider, then it’s blocked; Having a collider on a graph results in a fuzzy association between the node and the surrounding variables that influence it.
What is Conditioning ?
Conditioning means that you introduce information into the model about the variable of interest. In sociology, conditioning usually means controlling. It can also mean:
- Stratifying, restricting or adjusting the variable in some way.
- Performing analysis specific to one or more groups.
- Selective data collection (e.g. excluding certain groups from a survey).
Controlling for the collider will result in a phenomenon called “endogenous selection bias,” leading to the possibility of spurious correlations. This is also true if you condition on any children of the colliders (i.e. any nodes further down the path). The solution to endogenous selection bias is not to condition under these conditions in the first place — it’s considered a rudimentary analytical mistake to do so. A theoretical exception to this is when the effects of the two arrows leading into the node cancel each other out. However, the probability of exact cancellation in real life scenarios is zero.
References:
Elwert, F. & Winship, C. (2014). “Endogenous Selection Bias: The Problem of Conditioning.” In Annual Review of Sociology. Vol. 40: 31-53.
Greenland, Sander; Pearl, Judea; Robins, James M (January 1999), “Causal Diagrams for Epidemiologic Research” (PDF), Epidemiology, 10 (1): 37–48.
Jewell, N. (2003) Statistics for Epidemiology. Chapman & Hall/CRC.
Watkins, T. (2018). Understanding Uncertainty and Bias to Improve Causal Graphs.