What is a Box Cox Transformation?
A Box Cox transformation is a transformation of non-normal dependent variables into a normal shape. Normality is an important assumption for many statistical techniques; if your data isn’t normal, applying a Box-Cox means that you are able to run a broader number of tests.
The Box Cox transformation is named after statisticians George Box and Sir David Roxbee Cox who collaborated on a 1964 paper and developed the technique.
Watch the video for a short overview of the Box Cox:
Can’t see the video? Click here to watch it on YouTube.
Running the Test
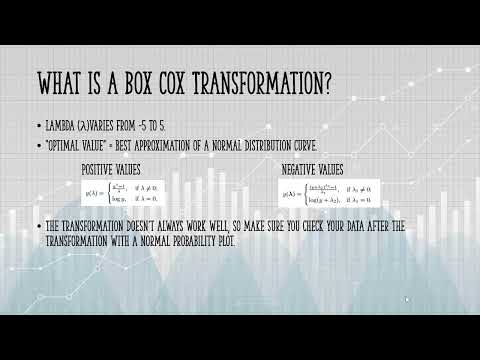
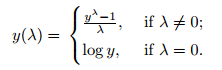
At the core of the Box Cox transformation is an exponent, lambda (λ), which varies from -5 to 5. All values of λ are considered and the optimal value for your data is selected; The “optimal value” is the one which results in the best approximation of a normal distribution curve. The transformation of Y has the form:
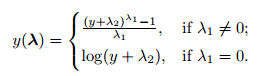
This test only works for positive data. However, Box and Cox did propose a second formula that can be used for negative y-values:
The formulae are deceptively simple. Testing all possible values by hand is unnecessarily labor intensive; most software packages will include an option for a Box Cox transformation, including:
- R: use the command boxcox(object, …).
- Minitab: click the Options box (for example, while fitting a regression model) and then click Box-Cox Transformations/Optimal λ.
| Common Box-Cox Transformations | |
| Lambda value (λ) | Transformed data (Y’) |
| -3 | Y-3 = 1/Y3 |
| -2 | Y-2 = 1/Y2 |
| -1 | Y-1 = 1/Y1 |
| -0.5 | Y-0.5 = 1/(√(Y)) |
| 0 | log(Y)** |
| 0.5 | Y0.5 = √(Y) |
| 1 | Y1 = Y |
| 2 | Y2 |
| 3 | Y3 |
**Note: the transformation for zero is log(0), otherwise all data would transform to Y0 = 1.
The transformation doesn’t always work well, so make sure you check your data after the transformation with a normal probability plot.
References
Box, G. E. P. and Cox, D. R. (1964). An analysis of transformations, Journal of the Royal Statistical Society, Series B, 26, 211-252. Available online here.
Agresti A. (1990) Categorical Data Analysis. John Wiley and Sons, New York.
Klein, G. (2013). The Cartoon Introduction to Statistics. Hill & Wamg.
Levine, D. (2014). Even You Can Learn Statistics and Analytics: An Easy to Understand Guide to Statistics and Analytics 3rd Edition. Pearson FT Press