The Excel BINOM.DIST / BINOMDIST function is a way to create a binomial distribution from a set of data entered into a worksheet. Use this function to calculate probabilities for problems with:
- A fixed number of trials,
- Two outcomes: success or failure,
- Independent trials,
- Constant probability of success.
BINOMDIST Excel Example
Watch the video below or keep reading to learn more.
Can’t see the video? Click here.
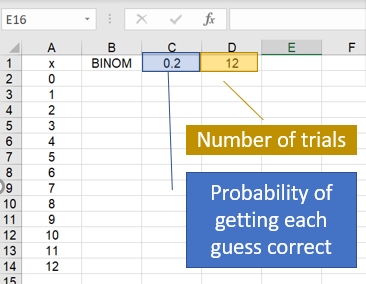
Let’s say you’re playing a game of marbles where you have to guess whether your opponent has odd or even marbles (like the game played by Gi-Hun and the old man in Squid Game). As you can’t see your opponents hand (and you’re not a mind reader), you have 50% chance (that’s .5 as a decimal) of guessing right for each round. You play 12 rounds. Here’s how you would set up the worksheet for that information:
I’m using Excel 365 for this example, but the function should work in all older versions back to Excel 2010. There is a subtle difference in the format:
- Excel 2010 & Up: Use BINOM.DIST
- Excel 2007 and earlier: Use BINOMDIST
BINOMDIST is compatible with all versions, although BINOMDIST may suffer from inaccurate calculations [1]. Microsoft updated the function in 2010 to offer better accuracy.
Using the Excel BINOMDIST Function for Probabilities
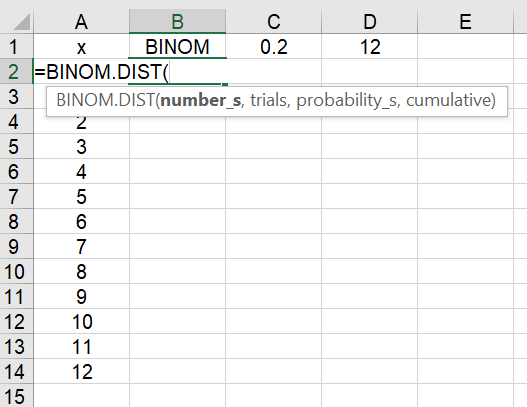
Step 1: Click on cell B2. Type =BINOM and double click the BINOM.DIST function.

Step 2: Complete the formula (without the quotation marks):
“=BINOM.DIST(A2,D$1,C$1,FALSE)”
The dollar sign next to D1 and C1 will keep that cell choice for all of the remaining calculations. For discrete probabilities (i.e. the probability of getting exactly 8 correct), choose FALSE. Typing TRUE here will give you cumulative probabilities.
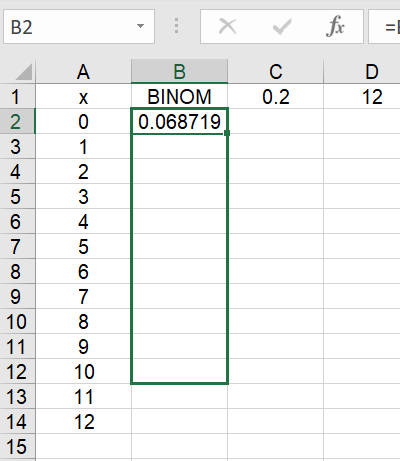
Step 2: Move the Formula Down the column by clicking on the little blue box at the bottom right of the cell and dragging it to the bottom of the column:
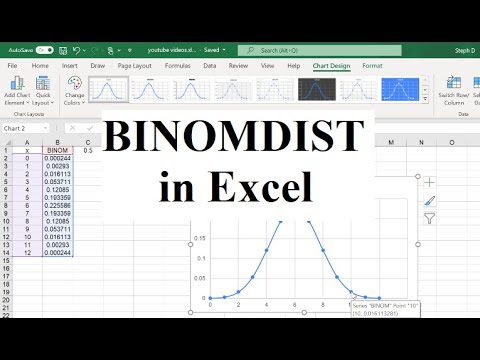
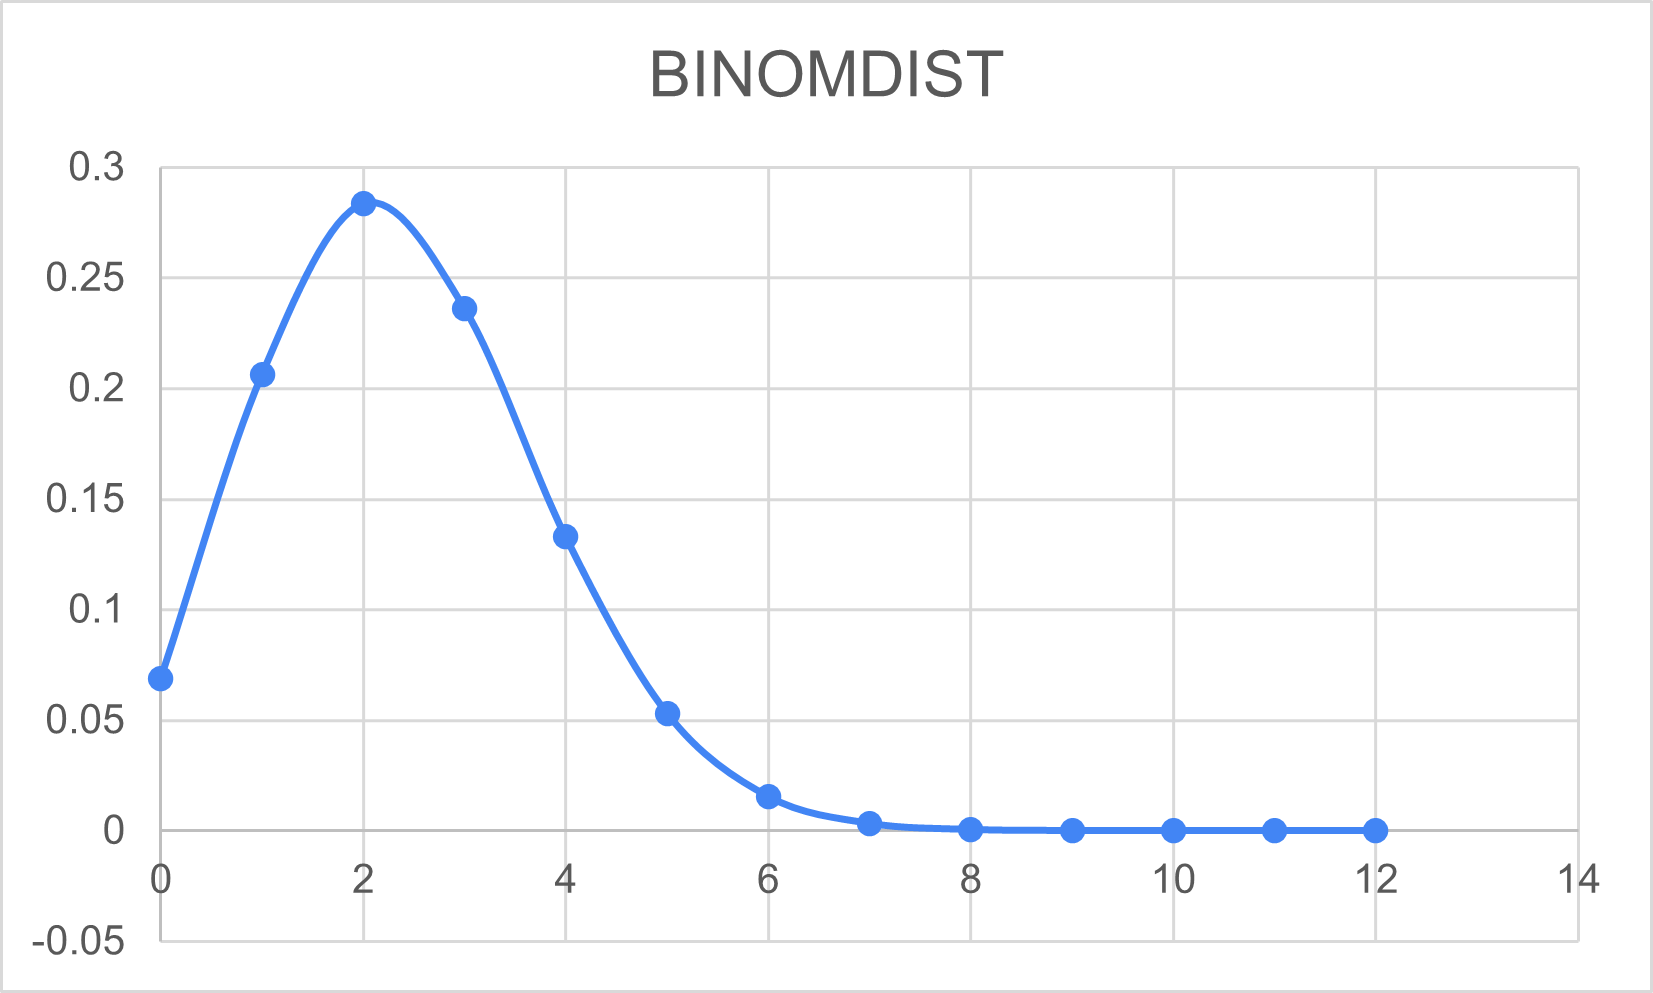
An optional step is to create a scatter plot with the data. Highlight the two columns, click the Insert tab and choose Scatter in the Charts section. You can see from the graph that the peak is at x = 6, which means we should expect to get six guesses right. The probability of getting zero or 12 guesses correct is extremely small (so small to be practically impossible):
References
[1] Knüsel, L. On the Accuracy of Statistical Distributions in Microsoft Excel 97. Retrieved October 4, 2021 from: https://citeseerx.ist.psu.edu/viewdoc/download?doi=10.1.1.368.2820&rep=rep1&type=pdf