Types of Graphs > Additive Tree
What is an Additive Tree?
An additive tree is a general way to represent clusters of data in a graph. It is used when your data table is composed of rows and columns that represent the same units; the measure must be a distance or a similarity.

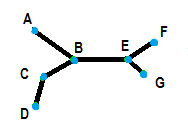
A “tree” is a finite, connected graph where any two nodes are connected by one path. In the above image, node B is connected by one path to node E, and node E is connected by one path to node F. The additive tree is a similar technique to cluster analysis. Both techniques have the “leaves” of the tree representing units. Where the additive tree differs is that the distance is graphically represented by the distance of those units on the tree.
Cluster analysis creates the clusters but does not create a graph that represents the results. An additional limitation of hierarchical cluster analysis is that objects in the same cluster must be exactly the same distance from each other, and the distances between clusters must be larger than the “within clusters” distance. Additive trees do not have these limitations.
Software that can Create Additive Trees
Many statistics software programs can produce additive trees. For example:
- The Matlab command is [addtree.m) and displaying them is [displaytree.m]. You can find more Matlab commands here. Michael Lee’s page on the UC Irvine website also has a downloadable zip file with all of the commands you can do in Matlab for representing similarity data.
- The SAS command for creating an additive tree is TREE. You can find comprehensive instructions for using the TREE procedure here on the SAS website.
Additive trees were originally developed by Sattah and Tversky in 1977.
References
Sattah, S. and Tversky, A. “Additive Trees.” 1977. Retrieved July 9, 2020 from: http://www.cs.technion.ac.il/~moran/COURSES/papers/SaTv77.pdf
Smith, C. (2017). Decision Trees and Random Forests: A Visual Introduction For Beginners: A Simple Guide to Machine Learning with Decision Trees. Blue Windmill Media.