Welcome to my statistics blog! I have a special interest in how statistics can lie but I’ll write about anything math-related.
Statistics Blog Index
Animal Testing Statistics: Is Experimentation Necessary?
Traveling Salesman Problem & TSP Art
Why do we use sigma / sqrt (n)? Statistics Made Easy. Six invaluable tips to make sure you pass your statistics class! Misleading Statistics Examples in advertising and in the news. Cool Math Games for Statistics and Probability. Some of my favorite (fun!) math games from around the web. Square Root Biased Sampling at the Airport. Perhaps this will be the end to me getting special attention every time I fly. Even physicians don’t understand statistics. That’s right — don’t believe everything your doctor tells you. Especially if it’s about cancer. A total of 767,622 animals were experimented on in 2015. This total does not include mice, rats, fish, reptiles and birds — animals that are not covered by the Animal Welfare Act. It’s estimated that around 100 million animals in total are used yearly in research, although the true figure is unknown as most experiments do not have to be reported to the FDA. It’s a misconception that animal testing for medicinal reasons is necessary and most of the time vivisection is completely ineffective. In a Journal of the American Medical Association article, researchers found that experiments on animals rarely translated to what happened when the drug was tested on people: “…patients and physicians should remain cautious about extrapolating the finding of prominent animal research to the care of human disease…poor replication of even high-quality animal studies should be expected by those who conduct clinical research.” (3) In general, animal experiments are a very unreliable indicator of how a drug will behave in a human being; This is one reason that new drugs are given sparingly in tiny amounts to a few people in Phase 1 clinical trials. Phase 1 trials test a drug for no other reason than safety, as researchers don’t trust results from animal experiments. Every potential new drug is required by the FDA to be toxicity tested on animals. That means countless animals are intentionally poisoned before a drug is every given to a person. Yet, these mass overdoses in animals have little to no effect on the drug making it to market; The overall success rate for drugs moving from Phase I clinical trials to FDA approval is only about 10%(4). That means the vast majority of drugs that showed promise in animal studies dare either not safe or do not work. Those that do work had side effects so severe the clinical trials had to be stopped. What about the argument that we need to test on animals to try and find a cure for serious diseases? A cure in an animal doesn’t translate all that well to a cure in humans. Dr. Richard Klausner, director of the National Cancer Institute, states: “We have cured mice of cancer for decades, and it simply didn’t work in humans.”(5) I have always been completely against animal experiments of any kind, for any reason. I do not donate to organizations or charities that experiment on animals (like the Susan G. Komen foundation), but I will donate to organizations that do not use animals (like the American Breast Cancer Foundation). As this site has grown over the years, more and more people are asking for help with their experiments — and some of those experiments involve animals. I realize I had moved from merely teaching statistics to actually helping people use statistics. The thought that I was helping any kind of experiment involving animals began to make me feel more and more comfortable. A recent dinner conversation also brought this issue to the forefront. A dinner guest was an animal experimenter and told the story of an experiment on mice that went horribly wrong. The animals were in severe pain and she called the head researcher for permission to put the animals out of their misery. He told her if she euthanized the suffering mice, she would be fired, because that would invalidate the experiment. This is not an unusual story in the animal experimentation world. In Canada in 2013(6), 78,294 animals experienced “severe pain near, at, or above the pain tolerance threshold of unanesthetized conscious animals.” I’m not going to share the gory details of what went wrong. You can read countless horror stories elsewhere on the web (like a href=”http://www.peta.org/issues/animals-used-for-experimentation/animals-laboratories/” target=”_blank” rel=”noopener noreferrer”>hereAnimal Testing in the United States

Is Animal Experimentation Necessary?
My Personal Stance
A comment was left on my blog this morning, asking for help with statistics on a rat experiment.
I politely declined, and decided to write this article instead.
I will no longer help any individual involved in animal experiments with their thesis/dissertations. Nor will I deal with companies who experiment on animals (or is conducting research based on experimentation).
Animal testing statistics conclude that animal experiments are unnecessary and ineffective. It’s time we all made changes to end this barbaric practice. Even small changes, like avoiding shampoo tested on animals, can help (just look for the leaping bunny logo on the back of the bottle). The Law of Large Numbers tells us that eventually, many small changes add up to a big one. Let’s all make small changes and end animal testing for good.
References for Animal Testing Statistics
- Funk, C. and Rainie,L. “Public and Scientists’ Views on Science and Society,” Pew Research Center, 29 Jan. 2015.
- Aldhous, P. and Coghlan, A. “Let the People Speak,” New Scientist 22 May 1999.
- Hackam, D. and Redelmeier, D, “Translation of Research Evidence From Animals to Human,” The Journal of the American Medical Association 296 (2006): 1731-2.
- Bill Berkrot (Rueters). “Success Rates for Experimental Drugs Fall.”
- Marlene Simmons et al., “Cancer-Cure Story Raises New Questions,” Los Angeles Times 6 May 1998.
- Canadian Council on Animal Care, “CCAC 2013 Animal Data Report,” 2015.
Online Statistics Book List
Even Physicians Don’t Understand Statistics One example highlighted in the report concerns mammogram results. A woman has a routine mammogram and is informed by her physician that the test is positive. As a woman who has had two abnormal mammograms, it can be a distressing experience. But the main question on my mind was “If my mammogram is positive, what are the odds that I actually have cancer?”. The last fact is perhaps the most shocking. One study (Eddy, 1982) reported that 95% of physicians estimated the probability of cancer, given a positive test, was 70-80%, rather than 7.8%! A woman walking into one of these physicians office’s with a positive mammogram result would be told her chances of cancer were almost certain (81 or 90 percent) when in fact her chances of cancer were relatively small. A large amount of women report depression and anxiety months after receiving an abnormal mammogram, so these physicians are putting needless extra stress on their patients. The main problem isn’t that statistics is hard, it’s that numbers in news reports and medical journals are often presented in confusing ways (just take a look at statistics on any major medical site to see examples). Even government information can be deceptive. In 1995, the UK government warned physicians that the risk of potentially lethal blood clots in the legs had doubled with the advent of new brands of contraceptives. That sounds very alarming until you read that the risk had risen from 1 in 7000 to 2 in 2000. That’s still a relatively low risk factor for a drug. A lot of students find this statistics blog through searches for “Online Statistics Book.” After all, with 600+ articles on elementary statistics, you’ve practically got a textbook for free (although you can check out our PDF version here). However, not everyone visiting this statistics blog is looking for a basic online statistics book. There are a lot of resources out there to help you if you’re looking for something a little more advanced. Here are some of my favorites: Eddy, D. (1982). Probabilistic reasoning in clinical medicine: Problems and opportunities. In D. Kahneman, P. Slovic, & A. Tversky
If you’re feeling overwhelmed by your statistics class — you aren’t alone. Even doctors don’t really understand statistics. The ramifications can be serious, as an article in the journal Psychological Science in the Public Interest points out.
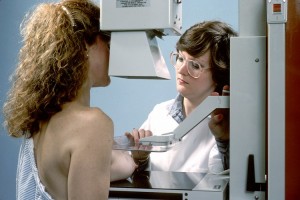
As a statistician, I know the odds are in my favor (not that it makes for a less distressing experience). However, in the report, the authors gave gynecologists (women’s reproductive health specialists) all of the information needed to answer that question (if a woman has a positive mammogram reading, what are the odds that she has cancer?). An alarming 80 percent of physicians got the answer wrong. The correct answer in the case given to them was 10 percent:
Online Statistics Book List
References
(Eds.), Judgment under uncertainty: Heuristics and biases (pp. 249-
267). Cambridge, England: Cambridge University Press.