A cumulative frequency distribution is an important tool for data analysis. It’s a way to show the sum of all values up to the current class in a frequency distribution. If you’re familiar with spreadsheets, it’s a lot like using the SUM() function but for data sets instead of individual cells. In this post, we’ll explain what a cumulative frequency distribution is and how to use it.
Contents:
- Cumulative Frequency Distribution definition and examples
- What is it used for?
- How to Make a Cumulative Frequency Distribution:
Definition and Examples
A cumulative frequency distribution is the sum of the class and all classes below it in a frequency distribution. All that means is you’re adding up a value and all of the values that came before it. For example, if we have three classes with frequencies of 5, 10, and 15 respectively, then our cumulative frequency distribution would be a single value: 30 (5+10+15).
Here’s another example: You get paid $250 for a week of work. The second week you get paid $300 and the third week, $350. To find the cumulative frequency distribution here, calculative your cumulative amounts of pay for weeks 2 and 3:
- Your cumulative amount for week 2 is $550 ($300 for week 2 and $250 for week 1).
- Your cumulative amount for week 3 is $900 ($350 for week 3, $300 for week 2 and $250 for week 1).
Cumulative frequency distributions can also be summarized in a table.

This table shows the frequency of hair colors for a population sample.
Example question: What is the value for ? in the above cumulative distribution table?
Solution: 41. To get this number, add up all of the frequencies in the second column (freq), stopping when you get to the third row (which is where the “?” is placed):
15 + 10 + 16 = 41.
What is a Cumulative Frequency Distribution used for?
Cumulative frequency distributions are useful for analyzing data sets because they allow us to quickly see how much of something has been accumulated over time. For example, if we had sales figures from each month over the course of one year, we could use CFDs to get an idea of how much total sales we had at any given point in time without having to manually add up each month’s numbers individually. This type of analysis can help us make decisions about our business strategy and determine where changes need to be made in order to maximize profits.
There are a couple of other reasons that you might want to use a cumulative frequency distribution:
- You want to check that your math is correct. By adding up all of the numbers and comparing it to your sample size, you know you’ve included all your data. For example if your sample size was 44 in this case, you’d know by the cumulative frequency distribution that you’re missing one piece of data.
- You’re interested in studying a population to find out a “more” or “less” question. For example, you’re thinking of opening a bargain grocery store and you want to know how many people in a particular geographic area spend up to $6000 per person per year in groceries. Your table might look like this:

The right column will tell you that 614 people spend up to 6000 per year. It includes everyone who spends up to $6000.
A cumulative frequency doesn’t have to just include everything less than something. In the above table, you could also start the cumulative distribution from the bottom. Let’s say you were the manager of a premium grocery store and you wanted to know how many people spend more than $5001 in groceries. Your cumulative distribution would look like this:

This tells you that 394 people spend more than that amount per year.
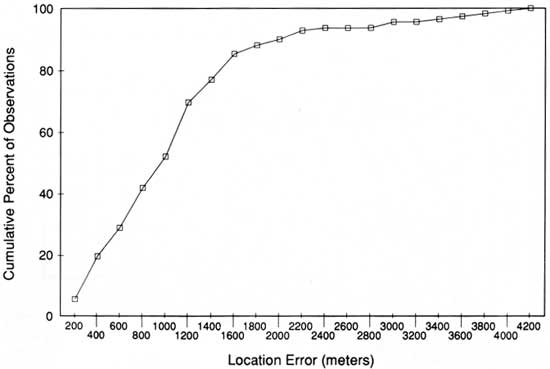
Although it’s usual to make tables for cumulative data, line graphs can also be used, like this cumulative frequency polygon:
How to Make a Cumulative Frequency Distribution Table
Like the explanation? Check out our easy to follow book, which has hundreds more examples, just like this one.
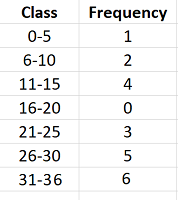
Example question: Build a cumulative frequency distribution table for the following data, using 7 classes: 1, 6, 9, 11, 12, 13, 14, 21, 21, 23, 26, 27, 28, 29, 29, 31, 31, 32, 33, 34, 35, 36 .
- Step 1: Build a frequency distribution table. Label column 1 with your class limits. In column 2, count the number of items in each class and fill the columns in as shown above. To fill in the columns, count how many items are in each class, using the chart.

-
- Step 2: Label a new column in your frequency distribution table “Cumulative frequency” and calculate the entries. The first entry will be the same as the first entry in the frequency column. The second entry will be the sum of the first two entries in the frequency column (highlighted in red).
Fill in the rest of the cumulative frequency column in the same way. The third entry will be the sum of the first three entries in the frequency column, the fourth will be the sum of the first four entries in the frequency column etc.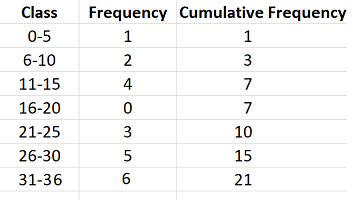
- You’re done! Like the explanation? Check out our statistics how-to book, with a how-to for every elementary statistics problem type.
Check out our YouTube channel for more stats help!
TI-89 Frequency Distribution: Cumulative Frequency Table Steps
Note that you must have the Stats/List Editor installed to be able to make a TI-89 frequency distribution using these instructions.
Example question: Build a cumulative frequency table for the following classes.

Step 1: Press APPS and scroll to Stats/List Editor. Press ENTER.
Step 2: Press F1 8 to clear any data in the editor.
Step 3: Name your first column “L1” by entering ALPHA 4 1.
Step 4: Enter your values into L1, following each number by an Enter key:
- 1 ENTER
- 2 ENTER
- 4 ENTER
- 0 ENTER
- 3 ENTER
- 5 ENTER
- 6 ENTER
Step 5: Move your cursor to on the header for column 2 (the column header will be highlighted). Press ALPHA 4 2 to name the column “L2.” Press ENTER. Use the up arrow to highlight the column header (L2).
Step 6: Press F3 2 6 to get the cumsum( function.
Step 7: Enter “L1” into the cumsum function by pressing ALPHA 4 1. Press the ) key then press ENTER.
Step 8: The list of cumulative frequencies for each value in L1 are returned in L2: 1, 3, 7, 7, 10, 15.
That’s it!
Tip: it doesn’t matter what the columns are called or headed. Just make sure you paste the header for column into the cumsum( function.
Lost your guidebook? You can download a new one from the TI website here.
TI 83 Cumulative Frequency Table
Example problem: Construct a cumulative frequency table for the grades of school children in Rock Hill elementary school (grades k-5). The grades are A (90+), B (80+), C (70+), and D (60+). The number of students achieving those grades are: A (20), B (21) C (52) and D (29).
Step 1: Enter the data list L1. Press the STAT button and then press ENTER. Enter the first column value (in our example, that’s 90), and then press ENTER. Continue entering numbers, pressing the ENTER button after each entry.
Step 2: Scroll to the right to list L2. Enter the next column’s values (20, 21, 52, and 29). Make sure you press ENTER after each value.
Step 3: Scroll to the right and up to highlight L3.
Step 4: Press 2nd STAT to reach the “LIST” menu.
Step 5:Scroll to the right to highlight “OPS” then press 6 for “cumSum.”
Step 6: Press 2nd 2 to get “L2,” then press ).
Step 7: Press ENTER. The TI 83 will sum the cumulative data in the L2 column and replace the results in L3, giving you a cumulative distribution table.
Tip: To clear the data from a list, place the cursor on the list name (for example, L1), press CLEAR, and then ENTER.
That’s how to create a TI 83 Cumulative Frequency Table!
Lost your guidebook? Download a new one here at the TI website.