Regression Analysis > Tolerance Intervals
What is a Tolerance Interval?
Tolerance intervals (also called enclosure intervals) are similar to prediction intervals, but they cover a fixed proportion of the population. They are where we expect a certain population proportion to lie. For a particular confidence interval, it tells you lower and upper values which have a specified proportion (or percent) contained within them.
Tolerance Intervals can be two-sided (a range , with a specified minimum and maximum) or one-sided (a range where one limit is either negative infinity or positive infinity).
Confidence, Prediction and Tolerance Intervals
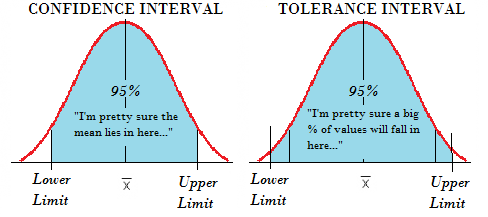
Tolerance intervals are often confused with confidence intervals and prediction intervals. They are not the same thing:
- A confidence interval contains a parameter (like a population mean) with a certain confidence level. In other words, it tells you about the likely location for a population parameter. For example, you might have 95% confidence that mean battery life is from 100 to 110 hours. That means if you repeat your experiment over and over again, 95% of the time the mean battery life will fall into that range.
- A prediction interval tells you where a value will probably fall in the future. For example, 95% prediction interval of 90 to 120 hours for the mean life of a battery tells you that future batteries produced will fall into that range 95% of the time. Prediction intervals are usually wider than confidence intervals.
- A tolerance interval covers a specified proportion of the population for a given confidence level. For example, 75% of the time, batteries will fall into the interval 90 to 120 hours, with 95% confidence.
A tolerance interval has a minimum value and a maximum value. These endpoints are called tolerance limits.
Calculating Tolerance Intervals
Tolerance intervals must have a minimum population percentage that you want to cover (e.g. “75% of the population” or “80% of the population”) and a confidence level (commonly, this is set at 95%). Usually, both values are close to 100%. The confidence level is the likelihood that a tolerance interval will actually cover the minimum percentage you state.
The formulas are different depending on what distribution shape you have and are dependent on the mean, standard deviation and tolerance factors. Tolerance factors are set by you. For example, let’s say you had a normal distribution and wanted to find lower(L) and upper(U) tolerance limits for a set of measurements Yn…,YN. The intervals would be defined by the following:
- YL=Ȳ−k2s;YU=Ȳ+k2s
- YL=Ȳ−k1s
- YU=Y&772;+k1s
The tolerance factors “k” are calculated so that the interval covers a specified proportion of the population with the specified confidence level.
Figuring out the factors is not an easy task and it’s best left to software. Many statistics packages have built in functions for calculating tolerance intervals. For example:
- In Minitab, click Stat > Quality Tools > Tolerance Intervals. This test covers normally distributed data only.
- In R, one option is the ‘tolerance’ package.
That said, if you want to tackle factor calculation by hand, 10-1-1-498-1113 covers tolerance factors for normal distributions. Need help with the calculations? Check out our tutoring page!
References
Everitt, B. S.; Skrondal, A. (2010), The Cambridge Dictionary of Statistics, Cambridge University Press.
Kotz, S.; et al., eds. (2006), Encyclopedia of Statistical Sciences, Wiley.
Janiga, I. & Garaj, I. “One-sided tolerance factors of normal distributions with unknown mean and variability.” MEASUREMENT SCIENCE REVIEW, Volume 6, Section 1, No. 2, 2006
Young, S. (2010), Book Reviews: “Statistical Tolerance Regions: Theory, Applications, and Computation”, TECHNOMETRICS, FEBRUARY 2010, VOL. 52, NO. 1, pp.143-144.