Contents:
Watch the video for an overview and how to find the mean of grouped data:
Can’t see the video? Click here to watch it on YouTube
What is Grouped Data?
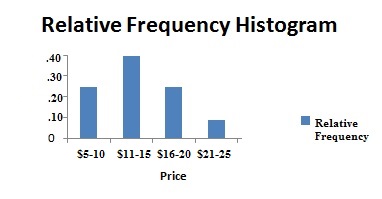
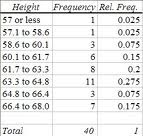
Grouped data is data that has been bundled together in categories. Histograms and frequency tables can be used to show this type of data:
The data is grouped together by classes or bins.
Grouped vs. Ungrouped Data
Ungrouped data is the data you first gather from an experiment or study. The data is raw — that is, it’s not sorted into categories, classified, or otherwise grouped. An ungrouped set of data is basically a list of numbers.
Calculating the Sample Mean for Grouped Data
When you have a frequency table or other group of data, the original set of data is lost — replaced with statistics for the group. You can’t find the exact sample mean (as you don’t have the original data) but you can find an estimate. The formula for estimating the sample mean for data that has been grouped is:
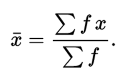
Where:
- x̄ is the sample mean,
- x is the class (or category) midpoint,
- f is the class frequency.
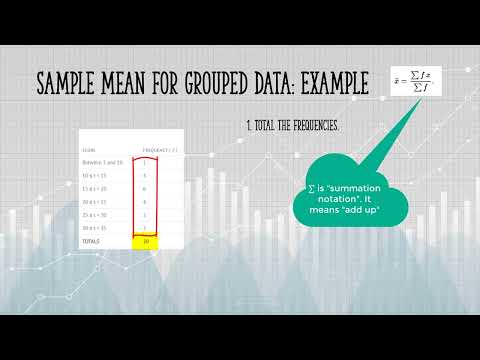
Example question: Find the sample mean for the following frequency table.
| Score | Frequency ( f ) |
|---|---|
| Between 5 and 10 | 1 |
| 10 ≤ t < 15 | 4 |
| 15 ≤ t < 20 | 6 |
| 20 ≤ t < 25 | 4 |
| 25 ≤ t < 30 | 2 |
| 30 ≤ t < 35 | 3 |
| TOTALS | 20 |
Step 1: Find the midpoint for each class interval. the midpoint is just the middle of each interval. For example, the middle of 10 and 15 is 12.5:
| Score | Frequency ( f ) | Midpoint ( x ) |
|---|---|---|
| Between 5 and 10 | 1 | 7.5 |
| 10 ≤ t < 15 | 4 | 12.5 |
| 15 ≤ t < 20 | 6 | 17.5 |
| 20 ≤ t < 25 | 4 | 22.5 |
| 25 ≤ t < 30 | 2 | 27.5 |
| 30 ≤ t < 35 | 3 | 32.5 |
| TOTALS | 20 |
Step 2: Multiply the midpoint (x) by the frequency (f):
| Score | Frequency ( f ) | Midpoint ( x ) | Midpoint x * frequency f |
|---|---|---|---|
| Between 5 and 10 | 1 | 7.5 | 7.5 |
| 10 ≤ t < 15 | 4 | 12.5 | 50 |
| 15 ≤ t < 20 | 6 | 17.5 | 105 |
| 20 ≤ t < 25 | 4 | 22.5 | 90 |
| 25 ≤ t < 30 | 2 | 27.5 | 55 |
| 30 ≤ t < 35 | 3 | 32.5 | 97.5 |
| TOTALS | 20 | 405 |
Add up all of the totals for this step. In other words, add up all the values in the last column (you should get 405).
Step 3: Divide the last column (f*x) by the second column (f):
The mean (x̄) = 405 / 20 = 20.25.
References
Agresti A. (1990) Categorical Data Analysis. John Wiley and Sons, New York.
Klein, G. (2013). The Cartoon Introduction to Statistics. Hill & Wamg.