Descriptive Statistics: Definition & Charts and Graphs >
What is a House Graph?
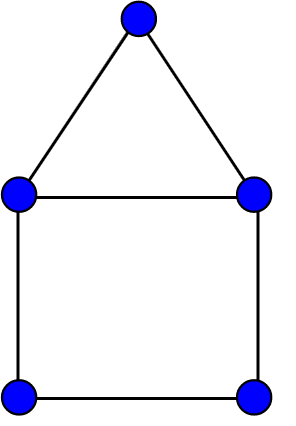
A house graph is a graph on 5 nodes and 6 edges, which is illustrated above in two embeddings. The name of this graph derives from its resemblance to a schematic illustration of a house with a roof. A house graph consists of five vertices or nodes (A, B, C, D and E) connected by six edges that are represented by lines between the vertices. The edges form an “X” shape with four outlying points (D and E). It has no loops or multiple edges.
Why Is It Important?
The house graph is important for many reasons. First, it demonstrates how graphs can represent real-world objects such as houses – making them easier to understand and visualize. Additionally, understanding how graphs work can help us better understand complex networks in nature (such as neural networks), as well as computers and other devices (like routers). This knowledge can also be used to create efficient algorithms for solving problems such as routing traffic on the internet or finding optimal paths between two points in a network. Finally, house graphs demonstrate basic principles of graph theory that are essential for exploring more advanced topics in mathematics such as Hamiltonian cycles, Euler circuits and planar graphs.
Conclusion
In conclusion, the house graph is an important concept in graph theory that helps us understand basic principles of graphs and their applications in real-world scenarios. Understanding how house graphs work can help us better understand complex networks found both in nature and technology. We hope this blog post has been useful for you high school students looking to learn more about graphs! Thanks for reading!
House graph image: Koko90, CC BY-SA 3.0