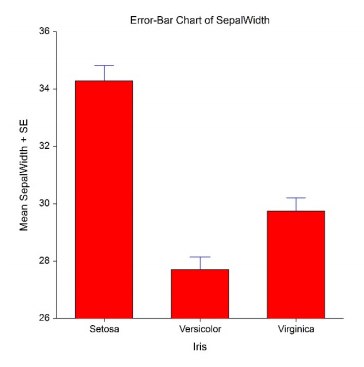
What is an Error Bar?
An error bar is a (usually T-shaped) bar on a graph that shows how much error is built in to the chart. The “error” here isn’t a mistake, but rather a range or spread of data that represents some kind of built in uncertainty. For example, the bar could show a confidence interval, or the standard error.
Depending on the type of graph, it could also show the data’s range , standard deviation or percentiles.
Types
Descriptive error bars show you something about the spread of data. For example:
- The range will tell you how spread out the data is, from the lowest to highest values.
- The standard deviation tells you a little about how the data is spread out around the mean.
Inferential error bars give you information about the results of studies. For example, an author might use error bars to show where the whole population mean probably lies, based on information gleaned from a sample. As it’s not possible to get an exact figure for the population mean (the author is basically taking a good guess), the bars show a range where you can expect to find the mean.
This list isn’t exhaustive; Error bars on a chart could literally mean anything the author wants to communicate: a spread of some kind, a built in equipment error, or something else. Every graph with error bars should have a key to tell you what they represent.
Error-Bar Charts
The term “Error-bar charts” could refer to any chart that has an error bar displayed on it. However, it also refers to a specific type of chart in NCSS Statistical Software. Specifically, they display tables of means, medians, or variability.

References
NCSS Statistical Software. Error-Bar Charts. Retrieved March 16, 2019 from: https://ncss-wpengine.netdna-ssl.com/wp-content/themes/ncss/pdf/Procedures/NCSS/Error-Bar_Charts.pdf