Contents (Click to skip to that section):
Cartesian Plane (X Y Graph) Definition
A Cartesian plane is a graph with one x-axis and one y-axis (that’s why it’s sometimes called an X Y graph). These two axes are perpendicular to each other. The origin (O) is in the exact center of the graph. Numbers to the right of the zero on the x-axis are positive; numbers to the left of zero are negative. For the y-axis, numbers below zero are negative and numbers above are positive.
Simply put: a Cartesian plane is just a number line with another number line at right angles.
The Cartesian plane matches a point on the plane with a pair of numbers located on the x and y axes. Each point on the plane has a unique set of numbers, called ordered pairs. The first point you get will always be on the X portion of the graph, and the second number will always be the Y. For example, (2,3) means 2 spaces on the x-axis and 3 on the y-axis.

The graph is named after the 16th century mathematician Rene Descartes.
Cartesian Plane Quadrants
Quadrants make up a lot of the work when it comes to trigonometry. When it comes to trig, there are four corners you need to know about on the graph.
- First Quadrant = Top right.
- Second Quadrant = Top left.
- Third Quadrant = Bottom left.
- Fourth Quadrant = Bottom right.

In this example, the first number in the set of ordered numbers listed (-1) is where the point is on the x-axis. In other words, the point is one space to the left of zero. The second number (-2) is where the point is on the y-axis. In other words, the point is two spaces below zero.
Fun fact: The invention of this system was revolutionary for its time. It gave us the first systematic link between algebra and geometry.
Ordinate and Abscissa on a Cartesian Plane
Ordinate and abscissa refer to ordered pairs on a Cartesian plane.
- The abscissa is the x-value (the first number in an ordered pair).
- The ordinate is the y-value (the second number in an ordered pair).
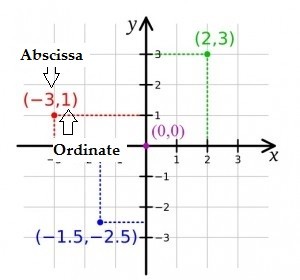
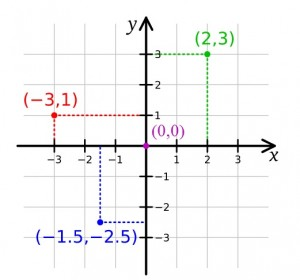
The above graph shows four ordered pairs:
- The first point (-3,1), -3 is the abscissa.
- For the second point (2,3), 3 is the ordinate.
- Following up, the point (0,0), 0 is the abscissa and the ordinate.
- For the point -1.5,-2.5, -1.5 is the abscissa and -2.5 is the ordinate.
Don’t forget that the first point you get will always be on the X portion of the graph, and the second number will always be the Y.
Ordinate and Abcissa: Other Definitions and Uses
While Ordinate and Abscissa are generally used to describe the first and second points in a coordinate system, they are sometimes used to mean something slightly different.
- Some dictionaries state that the terms are the distance between two points. For example, Merriam-Webster states an anscissa is “The horizontal coordinate of a point in a plane Cartesian coordinate system obtained by measuring parallel to the x-axis.” Use caution here, as this definition only works with positive numbers!
- In earlier geometry classes, the X-Axis was called the abscissa and the Y-Axis was called the ordinate. For example, The Journal of Experimental Medicine from 1896 states that “…the abscissa is divided into six to eleven segments, each representing a period of one week, while the ordinate is divided into ten segments representing the abstract units 1 to 10.” In some sciences, like physics and astronomy, some scientists still use that definition.
- The two terms can also be used in an oblique coordinate system. While the axes in a Cartesian plane are perpendicular, the axes in an oblique coordinate system are not.
I really recommend you take a look at Jason Dyer’s blog, where he goes all the way back to Fibonacci (c. 1170 – c. 1250) to find the words’ origins. That is— if you’re really interested in reading more confusing aspects about ordinate and abscissa and the history behind the terms!
Sketch the Graph on the Cartesian Plane
Let’s say you were given a function like f(x) = x2 – 2 (or, equivalently, y = x2 – 2) and asked to sketch the graph on the Cartesian Plane. In order to solve the problem you need to:
- Choose your x-values to input into the formula. Usually you’ll want to choose integers (whole numbers plus zero and negatives like -10, 3, 1, 7…) because they are easier to work with.
- Create a few (x, y) coordinates.
- Plot the points on a Cartesian plane.
- Draw the curve or line of the graph.
Sketch the Graph on the Cartesian Plane: Example
Example question #1: Sketch the graph of y = x2 – 2 on the Cartesian plane.
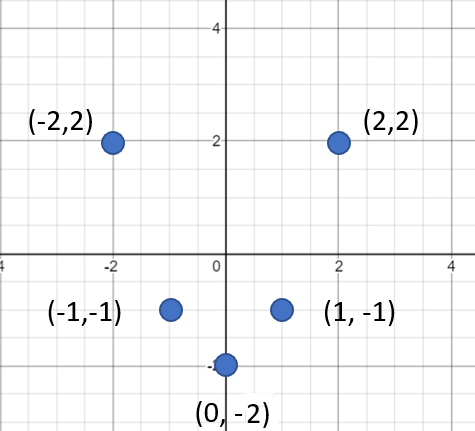
Step 1: Choose your x-values. It’s up to you what values to choose for your x-values, but pick numbers that are easy to calculate. A good starting point is a few values around zero: -2, -1, 0, -1, 2. Or you could try -10, -5, 0, 5, 10.
Step 2: Input your x-values from Step 1 into the function. To do this, you replace the “x” in the formula with the number you choose for x. Let’s use -2, -1, 0, -1, 2.
- y = x-2 – 2 = 2
- y = x-1 – 2 = -1
- y = x0 – 2 = -2
- y = x1 – 2 = -1
- y = x2 – 2 = 2
Step 3: Create a table of values from Steps 1 and 2. This step is optional, but it can help you see the (x, y) points a little more clearly:

Step 4: Plot the points.
Step 5: Draw the curve or line of the graph. This is really just connecting the dots.
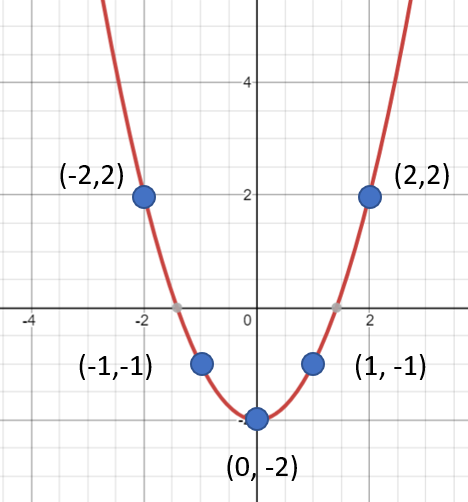
If you aren’t sure at this point about the shape of the graph, go back to Step 1 and choose a couple more x-values to complete the picture.
Step 6: Check your work. You could use a graphing calculator: I used the one at Desmos.com to create the graphs here.
If you can’t use a graphing calculator, throw in a random x-value as an input, like x = 9.2 or x = 7.5. If you have drawn your graph correctly, your new point will fall on the line you drew.
Tip: Unless you have a linear function, which always gives a straight line graph, draw a curve from each point to the next instead of a series of straight lines.
X Y Graph and the Cartesian Coordinate Graph
The Cartesian plane (or Cartesian coordinate graph) is practically the same thing as an X Y graph. This is because an X Y graph is the basic graph, where you can make a simple plot of a series of coordinates, make a scatter graph or a line graph. What makes the Cartesian Graph different than your standard graph? Well this graph focuses heavily on the four corners, as well as the traditional X and Y
Like a Cartesian plane, an X Y graph is a graph with two axes (axes is the plural of axis):
- A horizontal line going from left to right (the X axis).
- A vertical line going up and down (the Y axis).
Plotting Points on an X Y Graph
To plot a point, move along the x axis to find the first coordinate (the first number), then move up or down to find the second coordinate. Following this, draw a dot at that intersection.
The first point you get will always be on the X portion of the graph, and the second number will always be the Y. For example, (2,3) means 2 spaces on the x-axis and 3 on the y-axis.
A collection of points on an X Y graph is called a Scatter Plot because it looks like a scattered set of points.
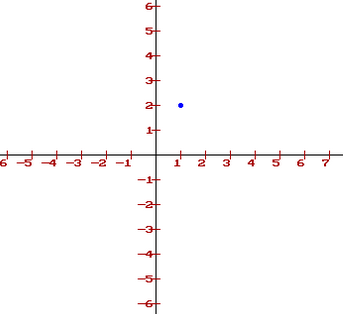
Make an X Y graph online: Straight away, you want to make sure you’ve drawn your points in the correct place, you can do this by checking out this online calculator from the Discovery Channel.Type in your points (make sure you use parentheses, like this: “(2,3)” and then click Draw them. The following image shows the point (2,3) drawn on the graph maker:
What is an Origin?
The origin is the reference point used to define all other points; a fixed point referred to when noting the geometry of a space. With this in mind, it is often denoted by O, and the coordinates are always zero.
In one dimension we simply write the origin as 0; it’s the point where we start numbering on a number line. You can go in either of two directions:
- Going left, you would count off negative numbers
- Going right, you would count off with positive numbers.
Either way you can go an infinite distance (to infinity or negative infinity).
In two dimensions, using the Cartesian plane, an origin is the point where the x and y axes intersect. This point is written as (0, 0).
In three dimensions, the origin is (0, 0, 0) and is defined as the place the x, y, and z axis intersect.
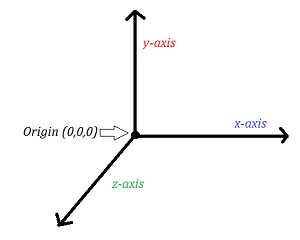
In n dimensions the origin will be the place n axes intersect, and every coordinate will be zero.
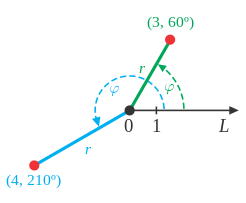
Polar Coordinate Systems
The origin in a polar coordinate system is also called a pole (not to be confused with a pole of a function in complex analysis, which is an isolated singularity). Every point is defined in terms of an angle and a ray (a line that starts at given coordinates and extends to infinity) from the pole. The pole on a polar coordinate system is (0,φ), where 0 is the intersection of the axes and φ is an angle where we rotate to.
Shifts
An origin is arbitrary, and can be shifted for convenience. If you are working in two dimensional Cartesian coordinates and shift your origin from (0, 0) to a place that was defined as (a, b), you will need to add (-a, -b) to the coordinates of every point.
For example, suppose you decide to change your origin to the point you’ve been calling (2, 4). Next (2, 4) is (0, 0) = O, your former (0, 0) is (-2, -4), and the point (3, 5) is (1, 1).
If you’re working with three dimensional geometry and want to switch to the point previously referred to as (6, 7, 8), you would translate each point from the old system to the new system by adding (-6, -7, -8) to the coordinates of each point. Following this, the point (20,20,20) would become (14, 13, 12).
Cartesian form (also called Cartesian representation or rectangular form) can refer to any function or relation written using (x, y) or (x, y, z) coordinates. Most of the time though, the term refers to a specific way of writing complex numbers.
It’s sometimes called “rectangular form” because a point in space, identified on an x and y axis, makes the shape of a rectangle.
Cartesian Form of a Complex Number
Complex numbers have two forms: Cartesian and polar form. The “usual” way (at least, the first way you learn to express complex numbers) is in Cartesian form: z = x + yi, where:
The right hand part of that equation, x + yi, is called the Cartesian form.
The other way complex numbers can be written is in polar form, which are made up of two parts, the modulus and argument. Polar form looks like this:
z = r∠θ
In Cartesian form, complex numbers can easily be plotted on an Argand diagram.
Example Question 1: What is the Cartesian form of the complex number (3 + i)(2 – i)2 – i ?.
Solution:
- Use FOIL to expand the squared term (2 – i)2, giving 3 – 4i.
- Use algebra to rewrite the newly expanded equation (3 + i)(3 – 4i)2 – i
- Expand using FOIL: 3 · 3 + 3(-4i) + i · 3 + i (-4i) -i
- Simplify and combine like terms:: 9 – 12i + 3i + 4 = 13 – 9i -i = 13 – 10i
The solution (in Cartesian form) is 13 – 10i.
Example: Polar Form to Cartesian Form
Example question 2: What is the Cartesian Form of z = 3∠40°?
Remember SOHCAHTOA from trigonometry? You can use that to convert to Cartesian form. First, a graph might help you visualize where the various parts are:
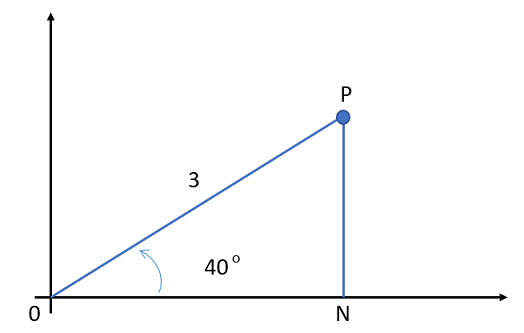
So:
References
Centre for Excellence. Sigma. The polar form of a complex number. Retrieved January 12, 2020 from: http://www.mathcentre.ac.uk/resources/sigma%20complex%20number%20leaflets/sigma-complex10-2009-1.pdf
Warner, S. Pure Mathematics for Pre-Beginners: An Elementary Introduction to Logic, Set Theory, Abstract Algebra, Number Theory, Real Analysis, Topology, Complex Analysis, and Linear Algebra Paperback – September 29, 2019. Get 800.
Thomas, R. Complex Numbers. Retrieved January 12, 2020 from: https://home.cc.umanitoba.ca/~thomas/Courses/ComplexRSDT.pdf