Descriptive Statistics > Unimodal Distribution
Unimodal Distribution : Overview
A unimodal distribution is a distribution with one clear peak or most frequent value. The values increase at first, rising to a single peak where they then decrease. The “mode” in “unimodal” doesn’t refer to the most frequent number in a data set (although it’s closely related)—it refers to the local maximum in a chart. Technically they are the same thing: one mode (one common number) will equal one peak in a graph. However, when you are looking at a graph and trying to decide if it’s a unimodal distribution or not, there’s no list of numbers to guide you.
Watch the video an overview:
The normal distribution is an example of a unimodal distribution; The normal curve has one local maximum (peak).

Other types of distributions in statistics that have unimodal distributions are:
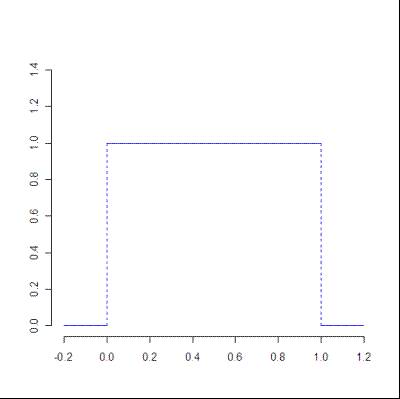
- The uniform distribution.
- The T-distribution.
- The chi-square distribution.
- The Cauchy distribution.
In elementary statistics, you probably will see the first three types of distribution listed above, but not the Cauchy. The Cauchy is a particular type of distribution where the expected value does not exist. See here for more information on the Cauchy distribution.
The uniform distribution is a type of probability distribution where the odds of getting any number within the range are the same. For example, if you roll a die, your odds of rolling any number (1, 2, 3, 4, 5, 6) are the same.
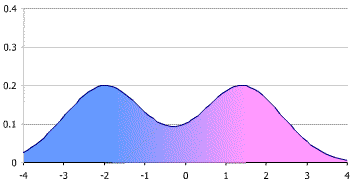
Bimodal Distribution
“Bi” means two, so there are two local maximums (peaks) in a bimodal distribution.
Symmetry and the Unimodal Distribution
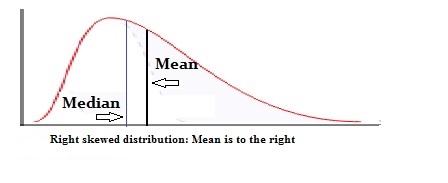
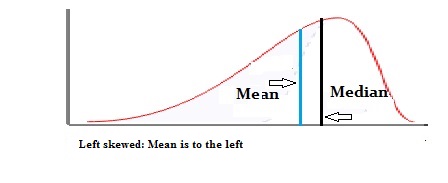
Unimodal distributions aren’t necessarily symmetric like the normal distribution. They can be asymmetric, or they could be a skewed distribution.
Other types of distributions
Multimodal distributions, where there are more than two peaks, are very rare. One example of a multimodal distribution is a trimodal distribution, which has three peaks.
U distributions have a distribution in the shape of the letter U, with large frequencies at the left and right of the distribution and few values in the middle.
Fun fact: The mean, median and mode often occur in alphabetical order (or reverse alphabetical order) on unimodal distributions.
References
Gonick, L. (1993). The Cartoon Guide to Statistics. HarperPerennial.
Vogt, W.P. (2005). Dictionary of Statistics & Methodology: A Nontechnical Guide for the Social Sciences. SAGE.