Spearman Rank Correlation / Spearman’s Rho
What is Spearman Rank Correlation / Spearman’s Rho?
The Spearman rank correlation coefficient, rs, is the nonparametric version of the Pearson correlation coefficient.
Watch the video of how to find Spearman Rank Correlation by Hand (No Tied Ranks):
Assumptions for Spearman’s Rank Correlation
Your data must be ordinal, interval or ratio.
In addition, because Spearman’s measures the strength of a monotonic relationship, your data has to be monotonically related. Basically, this means that if one variable increases (or decreases), the other variable also increases (or decreases).
Test Results
Spearman’s returns a value from -1 to 1, where:
+1 = a perfect positive correlation between ranks
-1 = a perfect negative correlation between ranks
0 = no correlation between ranks.
Contents:
Spearman Rank Correlation: Worked Example (No Tied Ranks)
The formula for the Spearman rank correlation coefficient when there are no tied ranks is:
![]()
Example Question:
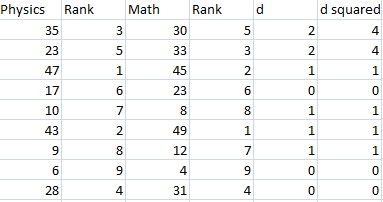
The scores for nine students in physics and math are as follows:
- Physics: 35, 23, 47, 17, 10, 43, 9, 6, 28
- Mathematics: 30, 33, 45, 23, 8, 49, 12, 4, 31
Compute the student’s ranks in the two subjects and compute the Spearman rank correlation.
Step 1: Find the ranks for each individual subject. I used the Excel rank function to find the ranks. If you want to rank by hand, order the scores from greatest to smallest; assign the rank 1 to the highest score, 2 to the next highest and so on:
![]()
Step 2: Add a third column, d, to your data. The d is the difference between ranks. For example, the first student’s physics rank is 3 and math rank is 5, so the difference is 2 points. In a fourth column, square your d values.
Step 3: Sum (add up) all of your d-squared values.
4 + 4 + 1 + 0 + 1 + 1 + 1 + 0 + 0 = 12. You’ll need this for the formula (the Σ d2 is just “the sum of d-squared values”).
Step 5: Insert the values into the formula. These ranks are not tied, so use the first formula:
![]()
= 1 – (6*12)/(9(81-1))
= 1 – 72/720
= 1-0.1
= 0.9
The Spearman Rank Correlation for this set of data is 0.9.
Spearman Rank Correlation: What to do with Tied Ranks
Tied ranks are where two items in a column have the same rank. Let’s say two items in the above example tied for ranks 5 and 6. The following image shows each tied data point assigned a mean rank of 5.5:
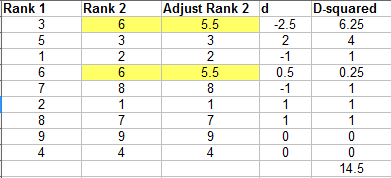
When this happens, you have a couple of options. You could also use the easier formula for tied ranks *if* you only have one or two tied ranks here and there. The image above shows the workings for the ties and the d-squared values you’ll need to input into the simple version of the formula above. However, that option may leave you with little confidence in any p-values you produce (Kinnear and Gray, 1999). A better option may be to calculate correlation with another method, like Kendall’s Tau.
Another option is simply to use the full version of Spearman’s formula (actually a slightly modified Pearson’s r), which will deal with tied ranks:
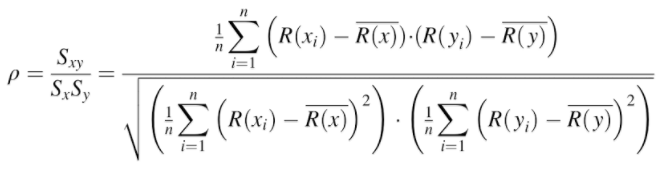
Where:
- R(x) and R(y) are the ranks,
- R(x)bar and R(y)bar are the mean ranks.
Check out our YouTube channel for hundreds of statistics help videos!
References
Clef, T. (2013). Exploratory Data Analysis in Business and Economics: An Introduction Using SPSS, Stata, and Excel. Springer Science and Business Media.
Kinnear and Gray (1999). SPSS for Windows Made Simple. Taylor and Francis.
Rees, D. (2000). Essential Statistics. CRC Press.