Contents:
Watch the video for an example:
What is Pearson’s Coefficient of Skewness?
Karl Pearson developed two methods to find skewness in a sample.
- Pearson’s Coefficient of Skewness #1 uses the mode. The formula is:
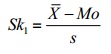
Where = the mean, Mo = the mode and s = the standard deviation for the sample.
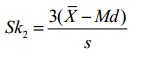
See: Pearson Mode Skewness. - Pearson’s Coefficient of Skewness #2 uses the median. The formula is:

Where = the mean, Mo = the mode and s = the standard deviation for the sample.
It is generally used when you don’t know the mode.
Example problem: Use Pearson’s Coefficient #1 and #2 to find the skewness for data with the following characteristics:
- Mean = 70.5.
- Median = 80.
- Mode = 85.
- Standard deviation = 19.33.
Pearson’s Coefficient of Skewness #1 (Mode):
Step 1: Subtract the mode from the mean: 70.5 – 85 = -14.5.
Step 2: Divide by the standard deviation: -14.5 / 19.33 = -0.75.
Pearson’s Coefficient of Skewness #2 (Median):
Step 1: Subtract the median from the mean: 70.5 – 80 = -9.5.
Step 2: Multiply Step 1 by 3: -9.5(3) = -28.5
Step 2: Divide by the standard deviation: -28.5 / 19.33 = -1.47.
Caution: Pearson’s first coefficient of skewness uses the mode. Therefore, if the mode is made up of too few pieces of data it won’t be a stable measure of central tendency. For example, the mode in both these sets of data is 9:
1 2 3 4 5 6 7 8 9 9.
1 2 3 4 5 6 7 8 9 9 9 9 9 9 9 9 9 9 9 9 10 12 12 13.
In the first set of data, the mode only appears twice. This isn’t a good measure of central tendency so you would be cautioned not to use Pearson’s coefficient of skewness. The second set of data has a more stable set (the mode appears 12 times). Therefore, Pearson’s coefficient of skewness will likely give you a reasonable result.
Interpretation
In general:
- The direction of skewness is given by the sign.
- The coefficient compares the sample distribution with a normal distribution. The larger the value, the larger the distribution differs from a normal distribution.
- A value of zero means no skewness at all.
- A large negative value means the distribution is negatively skewed.
- A large positive value means the distribution is positively skewed.
Pearson’s Coefficient of Skewness in Excel
There isn’t an Excel function to find Pearson’s coefficient of skewness. In the descriptive statistics area of the Data Analysis Toolpak, skewness is calculated by using the third power of deviations around the mean. This is different from Pearson’s coefficient of skewness, which uses either the mode or the mean. There is a workaround that you can use by combining some basic Excel functions.
Pearson’s coefficient of skewness (second method) is calculated by multiplying the difference between the mean and median, multiplied by three. The result is divided by the standard deviation. You can use the Excel functions AVERAGE, MEDIAN and STDEV.P to get a value for this measure.
Steps
Step 1:Type “Coefficient of Skewness” in an empty cell. for example, in cell A1.
Step 2:Type the following formula into a second empty cell. For example, in cell A2:
“=3*( AVERAGE(B2:B29)-MEDIAN(B2:B29) ) / STDEV.P(B2:B29)”
Step 3:Change the cell locations to reflect where your data actually is. In this example, the data is in B2 to B29 (B2:B29), so change your cell locations accordingly.
Step 4:Press “Enter.”
Tip: If you already know your mean, median and standard deviation, you would enter the actual numbers into the formula. For example, if you mean is 100, your median is 50 and your standard deviation is 12 you would enter:
“=3*(100-50)/12”
References
Beyer, W. H. CRC Standard Mathematical Tables, 31st ed. Boca Raton, FL: CRC Press, pp. 536 and 571, 2002.
Everitt, B. S.; Skrondal, A. (2010), The Cambridge Dictionary of Statistics, Cambridge University Press.
Lindstrom, D. (2010). Schaum’s Easy Outline of Statistics, Second Edition (Schaum’s Easy Outlines) 2nd Edition. McGraw-Hill Education
“Cook, T. (2005). Introduction to Statistical Methods for Clinical Trials (Chapman & Hall/CRC Texts in Statistical Science) 1st Edition. Chapman and Hall/CRC