Sometimes you think you can trust results from a survey, but it isn’t always easy to spot fake statistics. Do you believe an egg company when it tells you 50% of people in a taste test preferred a certain brand of eggs? How about if a survey of U.S. Marines showed support for massive military pay increases? Sometimes it isn’t enough to just accept the given data. Dig a little deeper and you might uncover the truth.
“There are lies, damned lies, and statistics.” ~ Mark Twain
Why Do Fake Statistics Exist?
There are three main reasons why fake stats exist:
- Deliberately misleading: To bolster a dubious claim, people might:
- Link to made up research.
- Show a fancy looking graph created with made up numbers.
- Link to an article published in a professional journal. But when the link is clicked, it actually downloads a non-published pdf from a public access site.
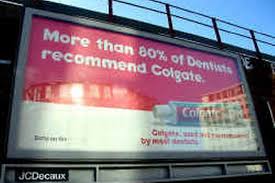
- Poor understanding: As anyone who has ever taken a stats class will tell you— stats is hard. Trying to decipher even the simplest stat is fraught with pitfalls. The billboard above leads you to believe that 80% of dentists recommend Colgate over any other brand; But the dentists in that particular poll actually recommended several brands (see: misleading graphs for a few more examples).
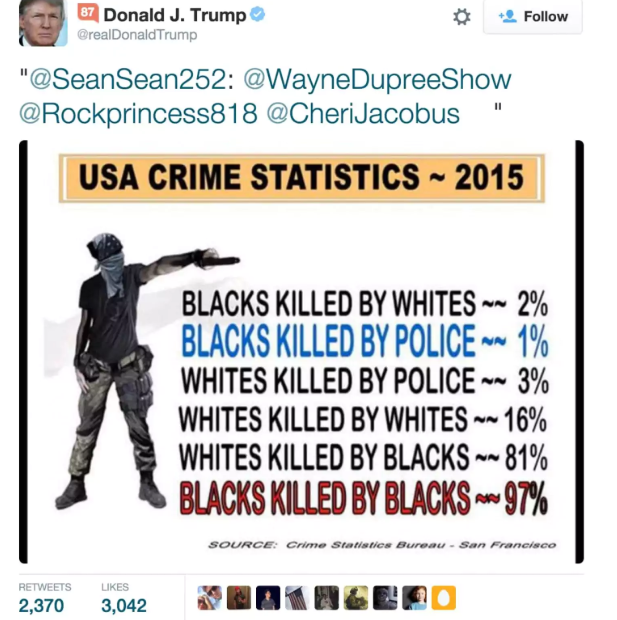
- Ignorance: Some people share stories without fact checking them. For example, Donald Trump famously shared a bogus graphic showing fake crime stats. The claims were widely debunked by FactCheck.org, The Washington Post, and others; the Post article linked to FBI data which shows just the opposite.
Questions to Ask
Who Paid for the Survey?
Take a close look at who paid for the survey. If you read that 90% of people lost 20 pounds in a month on a certain “miracle” diet, look at who paid. If it was the company who owns that “miracle” product, then it’s likely you have what’s called a self-selection study. In this type of study, someone stands to make money from the results of a trial or survey. You may have seen those soda ads where “90% of people prefer the taste of product X.” But if the manufacturer paid for that survey, you probably can’t trust the results.
Are the Opinions Biased?
Take a look to see if the statistics came from a voluntary survey, where people can choose to be included or not. For example, your professor might send you an email with an invitation to comment on what you think of a new book. These types of samples are biased toward people who have strong opinions (often negative ones). In other words, students are more likely to respond to the above survey if they hate the book. The students who like it will be less likely to respond.
Is Causation Proved?
Look for the faulty conclusion that one variable causes another in the survey. For example, you might read that unemployment causes an increase in corn production; corn products (like high fructose corn syrup) are cheap and therefore people are more likely to buy cheap foods when unemployed. But there may be many other factors causing an increase in production—including an increase in government subsidies. Just because one factor is seemingly connected to another (correlation), that doesn’t necessarily that one caused the other. More info: see Correlation vs. Causation.
Is the Publication Biased?
If you read a Tweet from Donald Trump, it likely has a leftist slant. On the other hand, Barack Obama’s website has a strong pro-Democrat bias. That may be common knowledge, but many biases aren’t as clear. How do you spot a biased news story? Look no further than Allsides.com, which keeps a tab of news sources and their biases. For example, CNS News tends to the far right, while Buzzfeed is somewhat leftist.
In particular, watch out for misleading percentages. Unemployment may have “slowed by 50%,” but if the unemployment rate was previously 100,000 new unemployment claims per month, that still means 50,000 people are joining the unemployed ranks every month.
In academic and professional writing, beware of publication bias. Specifically, journals are more likely to report positive results (for example, a drug trial that had a positive outcome) rather than a drug trial that failed. Just because a source publishes a positive result doesn’t mean that there aren’t others out there that reported the opposite.
Is the Sample Representative?
Make sure the sample size isn’t too limited in scope. It’s unlikely you can generalize about student achievement in the U.S. by studying a single inner city school in Brooklyn. And it’s unlikely you can make generalizations about American polling behavior by standing outside a polling booth in Mar-a-Lago Florida. Just as inner city schools don’t behave like every other school, a rich neighborhood can’t be used to generalize about the voting population. Also, make sure the sample size is large enough. If your voting precinct contains 1 million voters, it’s unlikely you’ll get any good results from surveying 20 people.
Are the Numbers Too Good to be True?
Beware of precise numbers. If a survey reports that 3,150,023 households in the U.S. are dog owners, you might believe that figure. However, it’s practically impossible that anyone would have seriously surveyed all of the households in the U.S. It’s much more likely they surveyed a sample and that 3,150,023 is an estimate. It should have been reported as “an estimated 3 million” to avoid being misleading.
Question Everything!
There are many other examples of fake statistics. Newspapers sometimes print erroneous figures, drug companies print fake test results, governments present fake statistics in their favor. The golden rule is: question every statistic that you read!
References
Huff, D. & Geis, I. (1993). How to Lie with Statistics. W. W. Norton & Company.
Manchester Evening News. Retrieved June 4, 2016 from: http://www.manchestereveningnews.co.uk/news/greater-manchester-news/kick-in-the-teeth-over-toothpaste-ads-979028.