What is an Explanatory Variable?
Watch the video or read on below:
An explanatory variable is a type of independent variable. The two terms are often used interchangeably. But there is a subtle difference between the two. When a variable is independent, it is not affected at all by any other variables. When a variable isn’t independent for certain, it’s an explanatory variable.
Let’s say you had two variables to explain weight gain: fast food and soda. Although you might think that eating fast food intake and drinking soda are independent of each other, they aren’t really. That’s because fast food places encourage you to buy a soda with your meal. And if you stop somewhere to buy a soda, there’s often a lot of fast food options like nachos or hot dogs. Although these variables aren’t completely independent of each other, they do have an effect on weight gain. They are called explanatory variables because they may offer some explanation for the weight gain.
The line between independent variables and explanatory variables is usually so unimportant that no one ever bothers. That’s unless you’re doing some advanced research involving lots of variables that can interact with each other. It can be very important in clinical research. For most cases, especially in statistics, the two terms are basically the same.
Explanatory Variables vs. Response Variables
The response variable is the focus of a question in a study or experiment. An explanatory variable is one that explains changes in that variable. It can be anything that might affect the response variable.
Let’s say you’re trying to figure out if chemo or anti-estrogen treatment is better procedure for breast cancer patients. The question is: which procedure prolongs life more? And so survival time is the response variable. The type of therapy given is the explanatory variable; it may or may not affect the response variable. In this example, we have only one explanatory variable: type of treatment. In real life you would have several more explanatory variables, including: age, health, weight and other lifestyle factors.
A scatterplot can help you see trends between paired data. If you have both a response variable and an explanatory variable, the explanatory variable is always plotted on the x-axis (the horizontal axis). The response variable is always plotted on the y-axis (the vertical axis).
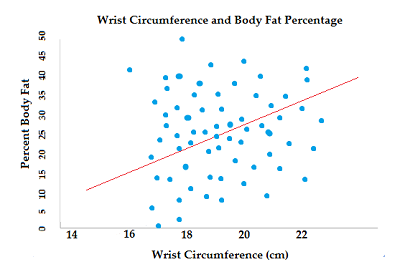
If you look at the above image, you should be able to tell that wrist size isn’t a very good explanatory variable to predict body fat (the response variable). The red line in the image is the “line of best fit.” Although it runs through the middle of the spread of dots, most of the dots aren’t anywhere near it. This means that the explanatory variable really isn’t explaining anything.
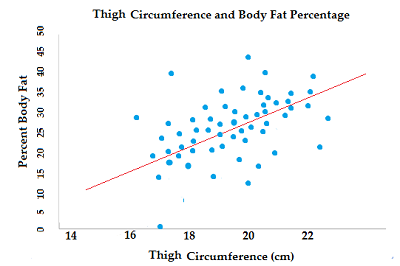
On the other hand, how large a person’s thighs are is a better predictor of body fat. Even this isn’t perfect. Many very fit people have large thighs! See how closer the dots are to the red line of best fit.
Check out our Youtube channel for hundreds of statistics help videos!
References
Levine, D. (2014). Even You Can Learn Statistics and Analytics: An Easy to Understand Guide to Statistics and Analytics 3rd Edition. Pearson FT Press
J Wilson at UGA COE. Assignment 2012.