Regression Analysis > ANCOVA
Contents:
- What is ANCOVA?
- Within-Group Variance
- General steps for ANCOVA
- Assumptions for ANCOVA
- ANCOVA in SPSS
In order to follow this article, you may want to read these articles first:
Analysis of Variance (ANOVA)
Regression Analysis

What is ANCOVA?
ANCOVA is a blend of analysis of variance (ANOVA) and regression. It is similar to factorial ANOVA, in that it can tell you what additional information you can get by considering one independent variable (factor) at a time, without the influence of the others. It can be used as:
- An extension of multiple regression to compare multiple regression lines,
- An extension of analysis of variance.
Although ANCOVA is usually used when there are differences between your baseline groups (Senn, 1994; Overall, 1993), it can also be used in pretest/posttest analysis when regression to the mean affects your posttest measurement (Bonate, 2000). The technique is also common in non-experimental research (e.g. surveys) and for quasi-experiments (when study participants can’t be assigned randomly). However, this particular application of ANCOVA is not always recommended (Vogt, 1999).
Extension of Multiple Regression
When used as an extension of multiple regression, ANCOVA can test all of the regression lines to see which have different Y intercepts as long as the slopes for all lines are equal.
Like regression analysis, ANCOVA enables you to look at how an independent variable acts on a dependent variable. ANCOVA removes any effect of covariates, which are variables you don’t want to study. For example, you might want to study how different levels of teaching skills affect student performance in math; It may not be possible to randomly assign students to classrooms. You’ll need to account for systematic differences between the students in different classes (e.g. different initial levels of math skills between gifted and mainstream students).
Example
You might want to find out if a new drug works for depression. The study has three treatment groups and one control group. A regular ANOVA can tell you if the treatment works. ANCOVA can control for other factors that might influence the outcome. For example: family life, job status, or drug use.
Extension of ANOVA
As an extension of ANOVA, ANCOVA can be used in two ways (Leech et. al, 2005):
- To control for covariates (typically continuous or variables on a particular scale) that aren’t the main focus of your study.
- To study combinations of categorical and continuous variables, or variables on a scale as predictors. In this case, the covariate is a variable of interest (as opposed to one you want to control for).
Within-Group Variance
ANCOVA can explain within-group variance. It takes the unexplained variances from the ANOVA test and tries to explain them with confounding variables (or other covariates). You can use multiple possible covariates. However, more you enter, the fewer degrees of freedom you’ll have. Entering a weak covariate isn’t a good idea as it will reduce the statistical power. The lower the power, the less likely you’ll be able to rely on the results from your test. Strong covariates have the opposite effect: it can increase the power of your test.
General steps for ANCOVA
General steps are:
- Run a regression between the independent and dependent variables.
- Identify the residual values from the results.
- Run an ANOVA on the residuals.
Assumptions for ANCOVA
Assumptions are basically the same as the ANOVA assumptions. Check that the following are true before running the test:
- Independent variables (minimum of two) should be categorical variables.
- The dependent variable and covariate should be continuous variables (measured on an interval scale or ratio scale.)
- Make sure observations are independent. In other words, don’t put people into more than one group.
Software can usually check the following assumptions.
- Normality: the dependent variable should be roughly normal for each of category of independent variables.
- Data should show homogeneity of variance.
- The covariate and dependent variable (at each level of independent variable) should be linearly related.
- Your data should be homoscedastic of Y for each value of X.
- The covariate and the independent variable shouldn’t interact. In other words, there should be homogeneity of regression slopes.
ANCOVA in SPSS
Watch the video for a walkthrough of ANCOVA in SPSS:
A note on running ANCOVA in SPSS: This is one of the more complicated tests, partly because you have to test a variety of assumptions. The steps are outlined below, but if you are not familiar with running tests in SPSS and reading output for significance, you may want to watch the video.
ANCOVA in SPSS: Assumptions
- All assumptions for ANOVA must be met, like random samples.
- Covariate must be reasonably correlated with the independent variable.
- Homogeneity of regression slopes: the slopes of the regression lines representing the relationship between the covariate and independent variable are similar.
Running the Test
In this test, I’m testing to see if a Pretest is a Covariate for a Post test, for a variety of different teaching methodologies (in class, online, etc.). The null hypothesis for the test is that the means are equal for all groups.
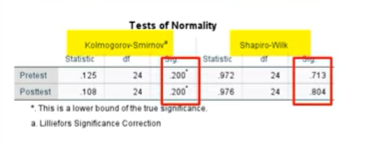
Step 1: Run a test for normality (to test that assumption).
- Click analyze → Descriptive statistics → explore.
- Move the pre- and post- test into the Dependent List box.
- Click the “Statistics” button, choose “Descriptive Statistics”.
- Click “Continue” then click “OK.”
- Choose the “Plots” button.
- Check “Histogram” and “Normality Plots”.
- Click “Continue” then “OK.”
- Read the output from the Tests of Normality. You do not want small p-values here. If your p-values are large, continue with ANCOVA in SPSS.
Step 2: Check for Homogeneity of Regression Slopes.
- Click analyze → General Linear Model → Univariate.
- Move post test to the Dependent variable box.
- Move methodology (your IV) to the Fixed Factors box.
- Click Pretest and move that to Covariate.
- Click Model, then “Build Terms”. Note: Make sure Interaction is showing in the “Build Terms” center box.
- Move methodology and pretest to the Model box on the right, then move the combination of the two to the right panel.
- Click OK.
- Look for a large p-value in the Methodology*Pretest section. This tells you the regression slopes are homogenous, so you can continue.
Step 3: Run ANCOVA.
- Click Analyze,
- General Linear Model → Univariate.
- Click “Reset”.
- Move Post Test to the Dependent Variable box.
- Move methodology (IV) to Fixed Factors.
- Move Pretest to the Covariate box.
- Click Model → Build Terms.
- Move Methodology (IV) to the Model panel.
- Move Pretest (Cov.) to the Model panel.
- Click “Continue”.
- Click EM means.
- Move methodology to “Display Means” and then select the “Compare Main Effects” check box.
- In Options, choose Descriptive Statistics, and Homogeneity Tests.
- Click Continue, then OK.
Step 4: Read the Results.
Important: Make sure there is a large p-value for Levene’s Test. If there is a small p-value (the default SPSS alpha level is 5%), you cannot continue. You may want to consider running a non-parametric test instead.
- Check for overall significance of the IV (Methodology) and Pretest (Covariate) in the Tests of Between-Subjects Effects. Again, look for small p-values. If these results are significant, you can continue.
- Check Pairwise significance. Small p-values here will tell you if you can reject the null hypothesis that the means are equal.
References and Further Reading
Bonate, P. (2000). Analysis of Pretest-Posttest Designs. CRC Press.
Horn, R. (n.d.). Understanding Analysis of Covariance. Retrieved October 26, 2017 from: http://oak.ucc.nau.edu/rh232/courses/eps625/
Leech, N. et. al (2005). SPSS for Intermediate Statistics: Use and Interpretation. Psychology Press.
Overall, J. (1993). Letter to the editor: The use of inadequate correlations for baseline imbalance remains a serious problem. J.Biopharm. Stat. 3, 271.
Senn, S. (1994). Testing for baseline balance in clinical trials. Statistics in Medicine. Volume 13, Issue 17.
Vogt, W. P. (1999). Dictionary of Statistics and Methodology: A Nontechnical Guide for the Social Sciences (2nd ed.). Thousand Oaks, CA: Sage Publications.