What is a Z Test?
 A Z-test is a type of hypothesis test—a way for you to figure out if results from a test are valid or repeatable.
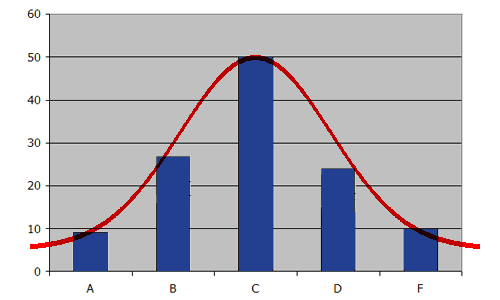
For example, if someone said they had found a new drug that cures cancer, you would want to be sure it was probably true. A hypothesis test will tell you if it’s probably true, or probably not true. A Z test, is used when your data is approximately normally distributed (i.e. the data has the shape of a bell curve when you graph it).
When you can run a Z Test.
Several different types of tests are used in statistics (i.e. f test, chi square test, t test). You would use a Z test if:
- Your sample size is greater than 30. Otherwise, use a t test.
- Data points should be independent from each other. In other words, one data point isn’t related or doesn’t affect another data point.
- Your data should be normally distributed. However, for large sample sizes (over 30) this doesn’t always matter.
- Your data should be randomly selected from a population, where each item has an equal chance of being selected.
- Sample sizes should be equal if at all possible.
How do I run a Z Test?
Running a Z test on your data requires five steps:
- State the null hypothesis and alternate hypothesis.
- Choose an alpha level.
- Find the critical value of z in a z table.
- Calculate the z test statistic (see below).
- Compare the test statistic to the critical z value and decide if you should support or reject the null hypothesis.
You could perform all these steps by hand. For example, you could find a critical value by hand, or calculate a z value by hand. For a step by step example, watch the following video:
Watch the video for an example:
You could also use technology, for example:
- Two sample z test in Excel.
- Find a critical z value on the TI 83.
- Find a critical value on the TI 89 (left-tail).
Two Proportion Z-Test
Watch the video to see a two proportion z-test:
This tests for a difference in proportions. A two proportion z-test allows you to compare two proportions to see if they are the same.
- The null hypothesis (H0) for the test is that the proportions are the same.
- The alternate hypothesis (H1) is that the proportions are not the same.
Example question: let’s say you’re testing two flu drugs A and B. Drug A works on 41 people out of a sample of 195. Drug B works on 351 people in a sample of 605. Are the two drugs comparable? Use a 5% alpha level.
Step 1: Find the two proportions:
- P1 = 41/195 = 0.21 (that’s 21%)
- P2 = 351/605 = 0.58 (that’s 58%).
Set these numbers aside for a moment.
Step 2: Find the overall sample proportion. The numerator will be the total number of “positive” results for the two samples and the denominator is the total number of people in the two samples.
- p = (41 + 351) / (195 + 605) = 0.49.
Set this number aside for a moment.
Step 3: Insert the numbers from Step 1 and Step 2 into the test statistic formula:
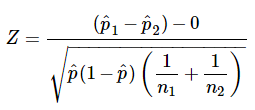
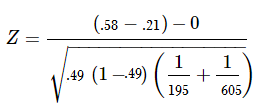
Solving the formula, we get:
Z = 8.99
We need to find out if the z-score falls into the “rejection region.”
Step 4: Find the z-score associated with α/2. I’ll use the following table of known values:
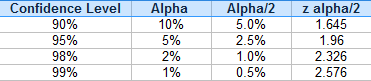
The z-score associated with a 5% alpha level / 2 is 1.96.
Step 5: Compare the calculated z-score from Step 3 with the table z-score from Step 4. If the calculated z-score is larger, you can reject the null hypothesis.
8.99 > 1.96, so we can reject the null hypothesis.
Check out our YouTube channel for more stats help and tips!
References
Casella, G., Berger, R. L. (2002). Statistical Inference. Duxbury Press. ISBN 0-534-24312-6.
Douglas C.Montgomery, George C.Runger.(2014). Applied Statistics And Probability For Engineers.(6th ed.). John Wiley & Sons, inc. ISBN 9781118539712, 9781118645062.
Gonick, L. (1993). The Cartoon Guide to Statistics. HarperPerennial.
Sprinthall, R. C. (2011). Basic Statistical Analysis (9th ed.). Pearson Education. ISBN 978-0-205-05217-2.