The uncertainty coefficient, also called the entropy coefficient, or proficiency, is a measure of the entropy (that is, uncertainty) in a column variable Y which a row variable X explains. It is sometimes expressed in symbols as or U(X|Y) or U(C|R), where C is columns and R is rows.
Disambiguation Note: Theil (1970) derived a large part of the uncertainty coefficient, so it’s occasionally referred to as “Theil’s U”. This is a little misleading, because the term Theil’s U usually refers to a completely different U— the U statistics used in finance. See: U: Statistic / Theil’s U.
Calculating the Uncertainty Coefficient
Uncertainty coefficients range from 0 to 1, inclusive. We can calculate it with the formula:
U(X|Y)= 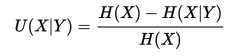 .
.
H(X) is the entropy of a single distribution. Entropy may be any number from 0 to ln(A), where A is the number of data points. A low entropy means very strong correlation; a high entropy implies low correlation and so low uncertainty. The entropy H(X) can be calculated by
![]()
The relative entropy of X given Y, H(X|Y), is calculated by
![]()
The sigma symbol (Σ) is summation notation and means to “add up”.
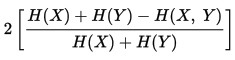
The Symmetric Uncertainty Coefficient
The uncertainty coefficient discussed is a measure of comparison, and is not symmetric. The symmetric uncertainty coefficient U (also sometimes written U(X, Y)) is what we get when take the weighted average of U(X|Y) and U(Y|X). This would be calculated by:
Strong Points of the Uncertainty Coefficient
The uncertainty coefficient is primarily used to check how effective or valid a particular statistical algorithm is. Since it verifies correlation, not “correctness”, it won’t penalize a algorithmic model just because it predicts the wrong class. Instead, it penalizes inconsistency. This means it isn’t affected by the (relative) fractions of the different classes that are set up.
This sets it apart from other ways you might test accuracy, ways such as precision (i.e. positive predicted value) and recall (the true positive rate or sensitivity of a test). The uncertainty coefficient is particularly useful when evaluating clustering algorithms. (These have no particular ordering, and the order blind evaluation of the coefficient allows us to get to the heart of the correlation).
References
Nehmzow, U. (2006). Scientific Methods in Mobile Robotics: Quantitative Analysis of Agent Behaviour. Springer Science.
SAS Institiute (1999). Measures of Association. Retrieved from http://www.okstate.edu/sas/v8/sashtml/stat/chap28/sect20.htm on Dec 30, 2017
Theil, H. (1970). On the Estimation of Relationships Involving Qualitative Variables. American Journal of Sociology. Vol. 76, No. 1 (Jul.), pp. 103-154
Vogt, W.P. (2005). Dictionary of Statistics & Methodology: A Nontechnical Guide for the Social Sciences. SAGE.