What is the Traveling Salesman Problem?
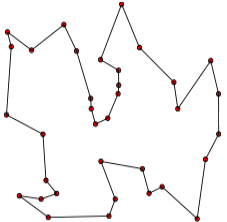
The Traveling Salesman Problem answers the question “Given a list of cities you want to visit, what’s the shortest possible distance to visit all of them and return to your starting point?“. The problem was first described in an 1832 traveling salesman’s manual and has since gone on to stump generations of mathematicians and computer scientists.
Finding a Solution
The equation to calculate how many possible routes is given by (N − 1)!, where ! is a factorial and N is the number of cities. For example, if you have only two cities, then 2! = 2 x 1 = 2, which makes sense because you can go from A to B, or B to A. For 3 cities, 3! = 3 x 2 x 1 = 6. Now things start to get a little more complicated, as there are six possible routes between just 3 cities. If you label the cities A, B, and C, then the possible routes are:
- A → B → C
- A → C → C
- B → A → C
- B → C → A
- C → A → C
- C → B → A
Given 10 cities there’s an astounding 10! = 3,628,800 round trips to check. A paltry 15 cities gives you 15! = 1,307,674,368,000 potential routes.
The TSP problem is what mathematicians call NP-hard. Translated into English, that means “Impossibly hard by hand, but a computer can sometimes do it given the right algorithm.” Because of the massive computations required for more than just a few cities, optimization techniques are usually used to find near-optimal solutions.
Developed Algorithms
Some algorithms have come close to a general solution. For example, Gharan and colleagues (2011) developed an algorithm that works about 40% of the time.
In 2017, Ola Svensson, Jakub Tarnawski and László A. Végh published this solution, which works for asymmetrical traveling salesman problems by finding smaller and smaller optimal groups. The “regular” Traveling Salesman Problem involves visiting all vertices on a weighted undirected graph, while an Asymmetrical Traveling Salesman Problem (ATSP) allows for a directed graph. Asymmetric TSP allows for distances between nodes to be unequal. For example, if the terrain from A to B was uphill, the energy required to travel from A to B would be more than from B to A. The same logic works for San Francisco streets, toll roads which only charge one way, or other situations where the “cost” might be more in one direction. The seemingly small difference (directed vs. undirected) makes a huge difference in how the problem is solved (Lipton & Regan, 2017). At the time of writing (October, 2017), the paper hasn’t been peer-reviewed. However, Lipton & Regan state that it “…solves a long-standing open problem and is a breakthrough of the first order.”
There have also been a variety of specific large problems where an optimal solution has been found. For example:
- Very Large Scale Integration (VLSI) problem (85,900 locations); VLSI combines thousands of transistors into a single chip to make an integrated circuit. First studied in 1991, it was solved in 2004 (Applegate et al., 2009).
- In May 2004, the shortest tour between all cities in Sweden (24,978 cities) was found, with a total distance of about 72,500 km. At the time, it was the largest solved TSP problem.
Uses
So what’s this algorithm actually used for? According to Wired, the Traveling Salesman Problem “…has practical applications to processes such as drilling holes in circuit boards, scheduling tasks on a computer and ordering features of a genome.” Other uses include agriculture, internet planning, and microchip production. It can also be used to produce some pretty cool computer generated art.
History
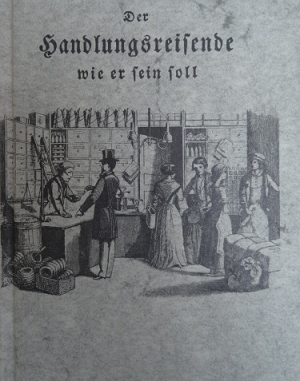
The origin of the name Traveling Salesman Problem “…is a bit of a mystery” (Applegate et. al, 2011) although it’s certainly been in widespread use since the 1950s. It seems the name might have been coined (perhaps after someone saw a copy of Der Handlungsreisende) as a catchier name for Harvard mathematician Hassler Whitney’s 48 states problem from the 1930s. Operations Research pioneer Merrill Flood stated in a 1984 interview with Albert Tucker that
“I don’t know who coined the peppier name ‘Traveling Salesman Problem’ for Whitney’s problem, but that name certainly has caught on, and the problem has turned out to be of very fundamental importance.”
Whitney’s name comes up again and again, including in Dantzig et. al’s paper:
“Both Flood and A.W. Tucker (Princeton University) recall that they heard the problem first in a seminar talk by Hassler Witney at Princeton in 1934…”
TSP Art
This computer-generated image of Mona Lisa was created by Robert Bosch as a 100,000 city TSP problem.
If you’re feeling the burning desire to create computer generated TSP Art, check out the free, open source software StippleGen.
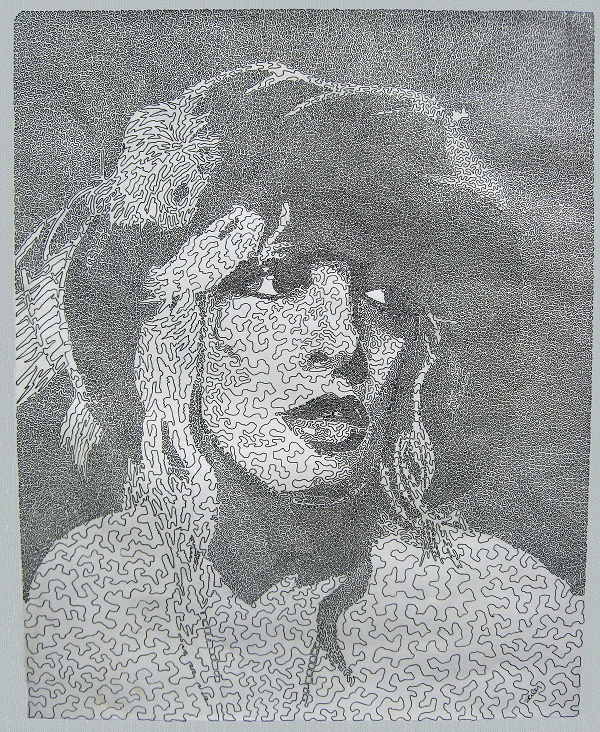
The concept of TSP art fascinated me and I became interested in creating hand drawn renditions. The process wasn’t NP-Hard, but it was frustratingly difficult to create at first. First, there was the problem of all the tones needed to create a black and white image. I’m going to give credit to Noli Novak and her beautiful stipple portraits for this one. I spent many hours studying her work and then translating it into a continuous line instead of a series of dots. At that point it became fun and reminded me of the dot-to-dot pictures I used to do when I was six. A few trial runs later and I buckled down to create my first one line drawing.
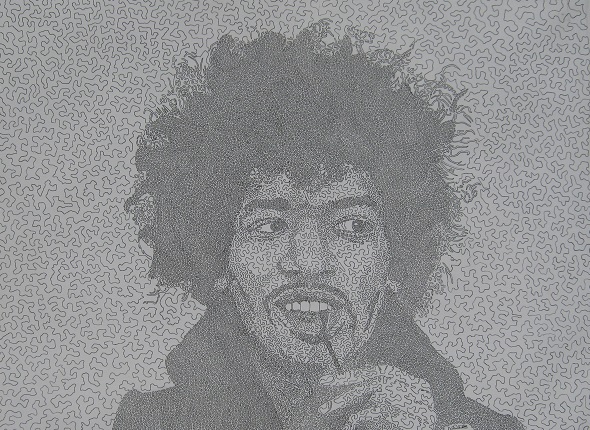
I’ve now completed a series of 5 TSP art pieces, all of which are now in private collections. These are hand drawn, pen and ink renditions of Jimi Hendrix, Diana Ross, David Bowie, Debbie Harry, and Stevie Nicks. I also created an oak tree, which turned out super cool though doesn’t have the “recognition” factor of the other 5. They aren’t perfect solutions for the Traveling Salesman Problem. Even if I did have the 3,498.4 years required to figure out the placement for the approximate 100,000 “cities”, I might choose the wrong algorithm to start with and end up getting it wrong anyway (if a computer only gets it right 60% of the time I imagine my odds are a lot lower).
The first piece is a 24″ x 36″ Traveling Salesman Problem portrait of Jimi Hendrix. He took roughly 40 hours of work. not counting the trial runs (of which there were many).
This is a larger piece (approx. 18″ x 24″) of Stevie Nicks.
I’ll post more Traveling Salesman Problem art in the coming weeks as I upload the images.
Math and Art
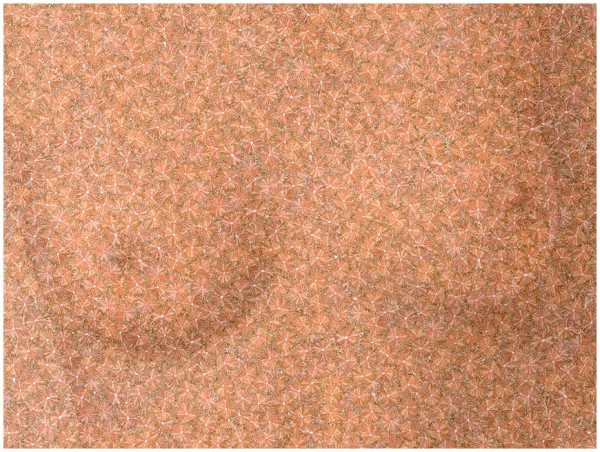
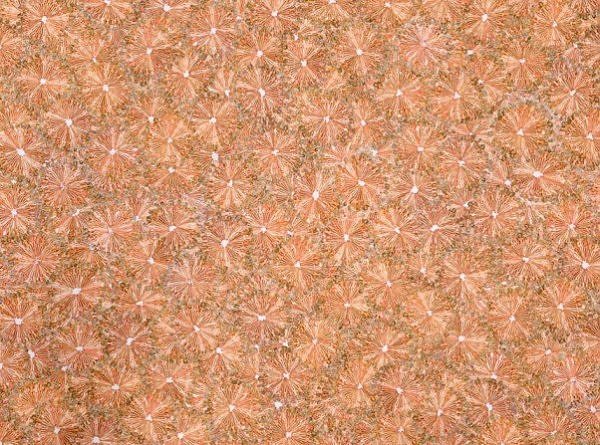
In my “spare time,” I’m an artist as well as a mathematician. As a visual artist, I’m well aware of the math/art connection. Golden ratios, proportions and grids to name a couple of ways math blends into art. Math can meet art in more surprising ways; In a recent art show, I partnered with Overstreet Ducasse where we created hypercubes). Last night, I watched a TED talk with photographer Chris Jordan. Until then, I didn’t think about how statistics can blend into art as well. Jordan turns statistics about American mass consumption into art.
Math and Art: Chris Jordan
Inspiration for Chris Jordan’s art is statistics. Statistics about life in the United States. Some are mind boggling. For example, did you know that:
- 106,000 aluminum cans are discarded every thirty seconds in the United States
- 28,000 42-gallon barrels of oil are used in the United States every two minutes. That’s equal to the flow of a medium-sized river
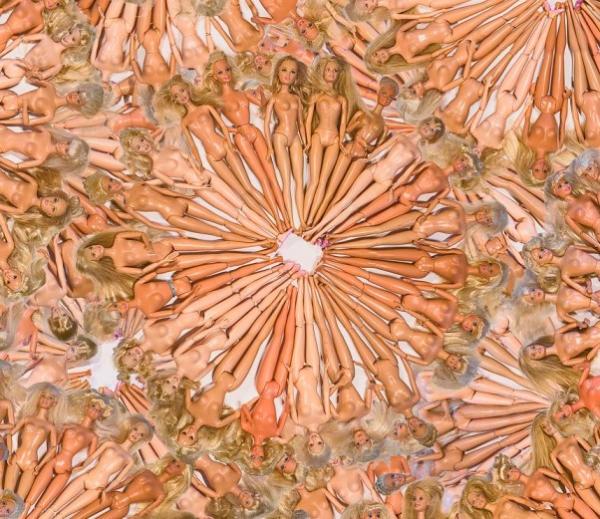
Jordan, a photographer, takes a few images of everyday items: Like plastic cups and turns them into massive pieces of art. He also uses photographs of some not-so-everyday items like prison uniforms. It was through Jordan’s artwork that I learned one-quarter of the world’s prison population is in the United States. That’s staggering!
Read more about Chris Jordan in this interview. The interview has some fantastic pictures that zoom in on the art. It gives you an idea of what it would be like to view the art in person. My favorite is the picture of 32,000 Barbie dolls, which represents the staggering number of elective breast augmentation (breast enlargement) surgeries performed in the United States in a single month!

Watch Chris Jordan’s math and art TED Talk on Youtube:
References
Applegate, D.L.; Bixby, R.E.; Chv´atal, V.; Cook, W.J.; Espinoza, D.G.; Goycoolea, M. & Helsgaun, K. (2009). Certification of an optimal TSP tour through 85900 cities. Operations Research Letters., Vol. 37, No. 1, pp. 11–15.
Applegate, D. et.al (2011). The Traveling Salesman Problem: A Computational Study. Princeton University Press.
Dantzig, G. et. al. (1954). Technical Report P-510. RAND Corporation, Santa Monica, California.
Gharan, S. et. al. (2011). A Randomized Rounding Approach to the Traveling Salesman Problem. Proceeding FOCS ’11 Proceedings of the 2011 IEEE 52nd Annual Symposium on Foundations of Computer Science. Pages 550-559
Lipton, R. & Regan, K. (2017. also in Computational Complexity Theory at the University at Buffalo (SUNY), state that it “…solves a long-standing open problem and is a breakthrough of the first order.” Article posted on Gödel’s Lost Letter and P=NP. Retrieved October 31, 2017 from https://rjlipton.wordpress.com/2017/09/11/a-tsp-breakthrough/
Skiena, S. “Traveling Salesman Tours.” §5.3.5 in Implementing Discrete Mathematics: Combinatorics and Graph Theory with Mathematica. Reading, MA: Addison-Wesley, pp. 199-202, 1990.
Merrill Flood (with Albert Tucker), Interview of Merrill Flood in San Francisco on 14 May 1984. The Princeton Mathematics Community in the 1930s, Transcript Number 11.
Svensson, O. et. al (2017). A Constant-Factor Approximation Algorithm for the Asymmetric Traveling Salesman Problem. Article posted on the Cornell.edu website. Retrieved October 31, 2017 from: https://arxiv.org/abs/1708.04215