Post Hoc > Studentized Range
Contents:
- Studentized Range & Distribution
- Q Table
Studentized Range & Distribution
The Studentized Range (q) is the difference between the largest and smallest data point in a sample, measured in terms of sample standard deviations. The studentized range distribution is the probability distribution of studentized ranges for independent, identically distributed random variables that are normally distributed. It is primarily used in post hoc tests, like Tukey’s HSD to limit the Type I error risk.
The shape of the studentized range distribution depends upon the context. For example, if you’re testing whether two means are equal, it is similar to the T distribution. However, it takes the number of means into account. The more means, the larger the critical value.
Formula
The formulas differ a little depending on what post hoc test you’re running. For example, the formula for calculating a q ratio for differences between means is:
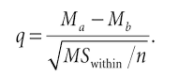
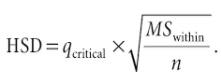
Like most hypothesis tests, a calculated value (from the formula) is compared with a table value (from the q critical value table below). In order to use this particular formula, you would have to calculate a q ratio for each pair of means to see if there is a statistically significant different for each pair. An alternate formula (which is really just a rearrangement of the formula above) is based on a difference between means instead of a q ratio:
For more details on how to run a post hoc test using the studentized range distribution, see:
Q Tables
Note: These are abbreviated tables with the most commonly used values. A more comprehensive table can be found in pdfepXJ7Z5yxl.
- Alpha = .05
- Alpha = .01
Q critical values for alpha = .05
df are for the Error Term
k= Number of Treatments
| df↓ k → | 2 | 3 | 4 | 5 | 6 | 7 | 8 | 9 | 10 |
| 5 | 3.64 | 4.60 | 5.22 | 5.67 | 6.03 | 6.33 | 6.58 | 6.80 | 6.99 |
| 6 | 3.46 | 4.34 | 4.90 | 5.30 | 5.63 | 5.90 | 6.12 | 6.32 | 6.49 |
| 7 | 3.34 | 4.16 | 4.68 | 5.06 | 5.36 | 5.61 | 5.82 | 6.00 | 6.16 |
| 8 | 3.26 | 4.04 | 4.53 | 4.89 | 5.17 | 5.40 | 5.60 | 5.77 | 5.92 |
| 9 | 3.20 | 3.95 | 4.41 | 4.76 | 5.02 | 5.24 | 5.43 | 5.59 | 5.74 |
| 10 | 3.15 | 3.88 | 4.33 | 4.65 | 4.91 | 5.12 | 5.30 | 5.46 | 5.60 |
| 11 | 3.11 | 3.82 | 4.26 | 4.57 | 4.82 | 5.03 | 5.20 | 5.35 | 5.49 |
| 12 | 3.08 | 3.77 | 4.20 | 4.51 | 4.75 | 4.95 | 5.12 | 5.27 | 5.39 |
| 13 | 3.06 | 3.73 | 4.15 | 4.45 | 4.69 | 4.88 | 5.05 | 5.19 | 5.32 |
| 14 | 3.03 | 3.70 | 4.11 | 4.41 | 4.64 | 4.83 | 4.99 | 5.13 | 5.25 |
| 15 | 3.01 | 3.67 | 4.08 | 4.37 | 4.59 | 4.78 | 4.94 | 5.08 | 5.20 |
| 16 | 3.00 | 3.65 | 4.05 | 4.33 | 4.56 | 4.74 | 4.90 | 5.03 | 5.15 |
| 17 | 2.98 | 3.63 | 4.02 | 4.30 | 4.52 | 4.70 | 4.86 | 4.99 | 5.11 |
| 18 | 2.97 | 3.61 | 4.00 | 4.28 | 4.49 | 4.67 | 4.82 | 4.96 | 5.07 |
| 19 | 2.96 | 3.59 | 3.98 | 4.25 | 4.47 | 4.65 | 4.79 | 4.92 | 5.04 |
| 20 | 2.95 | 3.58 | 3.96 | 4.23 | 4.45 | 4.62 | 4.77 | 4.90 | 5.01 |
| 24 | 2.92 | 3.53 | 3.90 | 4.17 | 4.37 | 4.54 | 4.68 | 4.81 | 4.92 |
| 30 | 2.89 | 3.49 | 3.85 | 4.10 | 4.30 | 4.46 | 4.60 | 4.72 | 4.82 |
| 40 | 2.86 | 3.44 | 3.79 | 4.04 | 4.23 | 4.39 | 4.52 | 4.63 | 4.73 |
| 60 | 2.83 | 3.40 | 3.74 | 3.98 | 4.16 | 4.31 | 4.44 | 4.55 | 4.65 |
| 120 | 2.80 | 3.36 | 3.68 | 3.92 | 4.10 | 4.24 | 4.36 | 4.47 | 4.56 |
| infinity | 2.77 | 3.31 | 3.63 | 3.86 | 4.03 | 4.17 | 4.29 | 4.39 | 4.47 |
Q critical values for alpha = .01
df are for the Error Term
k= Number of Treatments
| df↓ k → | 2 | 3 | 4 | 5 | 6 | 7 | 8 | 9 | 10 |
| 5 | 5.70 | 6.98 | 7.80 | 8.42 | 8.91 | 9.32 | 9.67 | 9.97 | 10.24 |
| 6 | 5.24 | 6.33 | 7.03 | 7.56 | 7.97 | 8.32 | 8.61 | 8.87 | 9.10 |
| 7 | 4.95 | 5.92 | 6.54 | 7.01 | 7.37 | 7.68 | 7.94 | 8.17 | 8.37 |
| 8 | 4.75 | 5.64 | 6.20 | 6.62 | 6.96 | 7.24 | 7.47 | 7.68 | 7.86 |
| 9 | 4.60 | 5.43 | 5.96 | 6.35 | 6.66 | 6.91 | 7.13 | 7.33 | 7.49 |
| 10 | 4.48 | 5.27 | 5.77 | 6.14 | 6.43 | 6.67 | 6.87 | 7.05 | 7.21 |
| 11 | 4.39 | 5.15 | 5.62 | 5.97 | 6.25 | 6.48 | 6.67 | 6.84 | 6.99 |
| 12 | 4.32 | 5.05 | 5.50 | 5.84 | 6.10 | 6.32 | 6.51 | 6.67 | 6.81 |
| 13 | 4.26 | 4.96 | 5.40 | 5.73 | 5.98 | 6.19 | 6.37 | 6.53 | 6.67 |
| 14 | 4.21 | 4.89 | 5.32 | 5.63 | 5.88 | 6.08 | 6.26 | 6.41 | 6.54 |
| 15 | 4.17 | 4.84 | 5.25 | 5.56 | 5.80 | 5.99 | 6.16 | 6.31 | 6.44 |
| 16 | 4.13 | 4.79 | 5.19 | 5.49 | 5.72 | 5.92 | 6.08 | 6.22 | 6.35 |
| 17 | 4.10 | 4.74 | 5.14 | 5.43 | 5.66 | 5.85 | 6.01 | 6.15 | 6.27 |
| 18 | 4.07 | 4.70 | 5.09 | 5.38 | 5.60 | 5.79 | 5.94 | 6.08 | 6.20 |
| 19 | 4.05 | 4.67 | 5.05 | 5.33 | 5.55 | 5.73 | 5.89 | 6.02 | 6.14 |
| 20 | 4.02 | 4.64 | 5.02 | 5.29 | 5.51 | 5.69 | 5.84 | 5.97 | 6.09 |
| 24 | 3.96 | 4.55 | 4.91 | 5.17 | 5.37 | 5.54 | 5.69 | 5.81 | 5.92 |
| 30 | 3.89 | 4.45 | 4.80 | 5.05 | 5.24 | 5.40 | 5.54 | 5.65 | 5.76 |
| 40 | 3.82 | 4.37 | 4.70 | 4.93 | 5.11 | 5.26 | 5.39 | 5.50 | 5.60 |
| 60 | 3.76 | 4.28 | 4.59 | 4.82 | 4.99 | 5.13 | 5.25 | 5.36 | 5.45 |
| 120 | 3.70 | 4.20 | 4.50 | 4.71 | 4.87 | 5.01 | 5.12 | 5.21 | 5.30 |
| infinity | 3.64 | 4.12 | 4.40 | 4.60 | 4.76 | 4.88 | 4.99 | 5.08 | 5.16 |
References
Duncan, David B. [1955]. Multiple range and multiple F tests. Biometrics li, 1-42.
H. Leon Harter. Critical Values for Duncan’s New Multiple Range Test. Biometrics, Vol. 16, No. 4, (Dec., 1960), pp. 671-685
Warner, R. (2012). Applied Statistics. SAGE.