This article is about Strip-Plot experimental design. For the strip plot graph (a type of scatter plot), see: What is a Dot Plot?
What is a Strip-Plot Design?
You may want to read about factors and blocks first.
Strip-plot designs (also called split-blocks) were originally used in wheat experiments (hence the word “plot” in the name). Today, they are also widely used in business and industry. Let’s say you had two factors A and B, each of which require large plot areas. Both factors have multiple levels a and b. For example, factor A could be irrigation; The levels (a) for irrigation could be: none, 1″ per day and 3″ per day. A complete factorial design—one which has each combination of each level—would require a*b large plots. If this isn’t practical (usually due to cost), a strip-plot design can be used as an alternative.
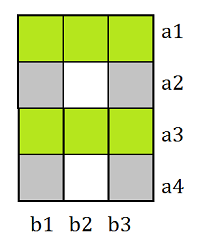
In a strip-plot design, the whole available area is divided into a horizontal strips and b vertical strips. One level of factor A is assigned to each row and one level of factor b is applied to each column. For example, if you had 3*4=12 factors, your plot would have 12 sections:
Split-Block vs. Split Plots
Although similar sounding, strip plots are not the same as split-plot designs. The main difference between split-block and split-plot experiments is the application of a second factor.
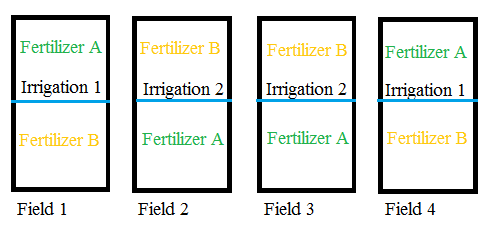
In a split-plot design, levels of a second factor are nested within a whole-plot factor. In the “usual” split-plot design, a mixture of hard to randomize (or hard-to-change) and easy-to-randomize (or easy-to-change) factors. The hard-to-change factors are implemented first, the fields are split in two, then the easier-to-change factors are implemented.
In the split-block design, the “plots” are split horizontally and vertically according to how many levels are present in the experiment. In other words, the first, whole-plot factor is completely crossed with a second factor.
References
Cheng, C. (2008). Complete factorial experiments in split-plots and strip-plots. Retrieved March 13, 2018 from: https://www.stat.berkeley.edu/~cheng/Lecture13.pdf
Federer, W. & King, F. (2007). Variations on Split Plot and Split Block Experiment Designs 1st Edition. Wiley-Interscience.
Visual Numerics (2003). Analyzing Statistically Designed Experiments. Retrieved March 13, 2018 from: https://www.roguewave.com/sites/rw/files/attachments/DOEWP.pdf