Descriptive Statistics > Stemplot / Stem and Leaf Plot
What is a Stemplot?
A stemplot is like a histogram — they are both tools to help you visualize a data set. Stemplots show a little more information than a histogram and have been a common tool for displaying data sets since the 1970s. They are typically used when there is a medium amount of quantitative variables to analyze; Stemplots of more than 50 observations are unusual. The name “Stem plot” comes because there is one “stem” with the largest place-value digits to the left (shaded in gray in the image below) and one “leaf” to the right.
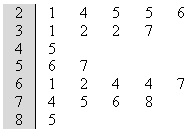
The first few values from this stemplot are:
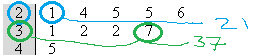
21 24 25 25 26 (the first line).
31 32 32 37 (the second line)
What are Stemplots used For?
A stem and leaf plot is a way to plot data where the data is split into stems (the largest digit) and leaves (the smallest digits). They were widely used before the advent of the personal computer, as they were a fast way to sketch data distributions by hand. They are used less frequently today, but you’ll still see some here and there.
The stem and leaf plot is used like a histogram; it allows you to compare data. While a histogram uses bars to represent amounts, the leaves of the stemplot represent amounts. A very long leaf means that “stem” has a large amount of data. The stems with the largest amount of data in the picture above are the 2 and 6 stems.
The numbers are arranged by place value. The largest place-value digits are placed in the stem. Stemplots in the real world aren’t usually labeled with the place-values that the stem represents — it’s usually up to you to figure it out based on the context and the data. However, in textbooks and other education materials it’s common for stemplots to be labeled. For example, a key next to the following stemplot tells you that 7|5 means 75, indicating that the stem represents tens and the leaf represents units.

Stem values are listed down (ascending order, from smallest to largest) and the leaf values are listed right to left (ascending order, from smallest to largest).
Advantages
Stem and leaf plots are useful in some cases because you can see where the bulk of scores lie. In the above graph, most scores were in the 20s or 60s. Bar graphs also show this information, but the advantage the stem and leaf plot have is that you can see all of the scores (other charts usually show just totals). These types of charts give you a quick overview of a distribution and you can also see the shape of the distribution (think of each leaf as representing a bar on a bar chart). They are also useful for highlighting the mode (the most common number in a data set) and for finding outliers.
Disadvantages
A disadvantage of stem and leaf plots is they are really only useful for small data sets from about 15 to 150 data points. Dot plots are usually more useful for smaller data sets, and for larger data sets a box plot or histogram is used.
Back-to-Back Stemplots
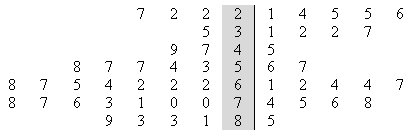
Back to back stemplots have two leaves that share a single stem. The stem on the back-to-back stemplot is shaded gray in the following picture.
What does it mean to Trim the Leaves on a Stemplot?
Trim the leaves means to get rid of unnecessary digits in your data. Let’s say you were plotting the following numbers on a stemplot:
141 162 112 153 137 106 103 82 151
For these numbers you would want the stem to be the hundreds place digit and the leaves the tens place. That makes the units unnecessary, so trim (round) them to get:
140 160 110 150 130 100 100 80 150
What Does it Mean to Split the Stem on a Stemplot?
Let’s say you have this set of data that you want to make a stemplot for:
140 160 110 150 130 100 100 80 150
170 200 170 100 170 360 150 150 260
The stems in this stemplot would be the hundreds digits (0,1,2,3). That would give you a very small stemplot with only four stems.
0
1
2
3
Ideally, you want between 6 and 20 stems on a stemplot. We only have four, so split the stems into two to get eight stems. The first part of the split stem you can use for 0-49 and the second part of the stem for 50-99. Here’s how the numbers 140 160 110 150 and 130 would be entered into this stemplot:
0
0
1 | 4 1 3
1 | 6 5
2
2
3
3
How to Make a Stemplot
Stemplots are made up of a stem (usually the highest place value digit) and “leaves”, which are the digits or units. For example, a simple stemplot of 10,21 and 32 would have tens as the highest order digits and 0,1, and 2 as the leaves. Think of a stemplot as being a histogram or bar chart made from actual numbers instead of blocks.
Example Question: Make a stemplot from the following data set, which represents 3rd grade test scores: 64, 82, 85, 99, 96, 81, 97, 80, 81, 80, 84, 87, 98, 75, 86, 88, 82, 78, 81, 86, 80, 50, 84, 88, 83, 82.
Step 1: Place the numbers in order from smallest to largest: 50, 64, 75, 78, 80, 80, 80, 81, 81, 81, 82, 82, 82, 83, 84, 84, 85, 86, 86, 87, 88, 88, 96, 97, 98, 99.
Step 2: Choose your stem. Generally, the stem will be the largest place value. For this data set, the largest place value is 10, so the stem for this sample question will represent the tens units.
Step 3: Separate your ordered numbers (from Step 1) into groups based on the place value you chose in Step 2. For this sample question we chose tens as the place value so the groups are:
50
64
75, 78
80, 80, 80, 81, 81, 81, 82, 82, 82, 83, 84, 84, 85, 86, 86, 87, 88, 88
96, 97, 98, 99.
Although not strictly necessary, this step makes it easier to visualize the stem-and-leaf plot coming together.
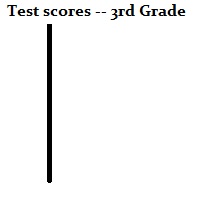
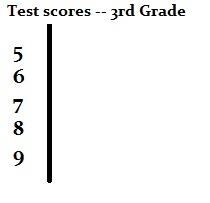
Step 4: Draw an outline of your graph. All that’s really needed to make a simple stemplot is a vertical line:
Step 5: Draw the stem numbers. For this sample problem, the stem represents tens. The scores range from 50 to 99 so the tens are 5,6,7,8, and 9.
Step 6: Draw the leaf digits based on the groupings from Step 3. Here are the leaf digits bolded, along with the finished stemplot:
50
64
75, 78
80, 80, 80, 81, 81, 81, 82, 82, 82, 83, 84, 84, 85, 86, 86, 87, 88, 88
96, 97, 98, 99
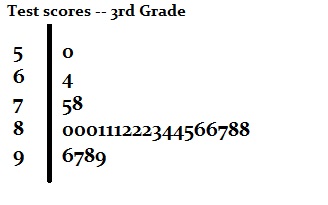
That’s how to make a stemplot, the easy way!
References
Moore, D. & Notz, W. (2019). Statistics: Concepts and Controversies. W. H. Freeman.