Sampling > Sampling Distribution of the Sample Proportion
The Sampling Distribution of the Population Proportion gives you information about the population proportion, p. For example, you might want to know the proportion of the population (p) who use Facebook. You can’t survey everyone on the planet, so you use a sample and get the sample proportion p̄ and use that as an estimator for p.
When studying the sampling distribution of the sample proportion, you’ll also see a lowercase p̄. The lowercase version refers to a single value (i.e. a single estimate).
Watch the video to see an example of the expected value and standard error formulas for the sample proportion.
Useful Formulas for Sampling Distribution of the Sample Proportion
- Expected value of the sampling distribution of P̄:
E(p̄) = p. - Variance for the sampling distribution of P̄:
p(1-p) / n. - Standard Error(SE) of the Sample Proportion:
√ (p(1-p) / n). Note: as the sample size increases, the standard error decreases. - You can use the normal distribution if the following two formulas are true:
- np≥5
- n(1-p)≥5.
- Z Score for sample proportion: z = (P̄ – p) / SE
Sample Proportion and the Central Limit Theorem
In most statistics books (and in real life), you’ll really only make inferences about population proportions if you have a large enough sample size. If you have a large enough sample size, you can use the normal distribution for the sampling distribution of P̂.
How large is “large enough”? Use these formulas for a general guideline:
- np≥5
- n(1-p)≥5.
For example, if you had a sample size (n) of 50 and a proportion of 30%, then:
n * p = 50 * .3 = 15
50(1-.3) = 50(.7) = 35.
These are both larger than 5, so you can use the normal distribution.
You can transform P̄ into a z-score with the following formula:
Z Score for sample proportion: z = (p̄ – p) / SE.
Example Question:
A certain company’s customers is made up of 43% women and 57% men. An aggressive marketing campaign results in an increase of women customers to 46%, according to a sample survey of 50 customers. If the company hadn’t run the campaign, how likely is it that 46% of customers are women? Was the campaign worth it?
Note that you’re looking for the probability that P̄ is greater than or equal to 46%.
Solution:
Step 1: Check that your sample size is large enough:
n * p = 50 * .43 = 21.5
50(1-.43) = 28.5.
Both are above 5, so we can use the normal distribution.
Step 2: Find the standard error(SE):
√ (p(1-p) / n) = √ (0.43(1-0.43) / 50) = 0.07.
Step 3: Find the z-score, using the SE you calculated in Step 2:
z = (P̄ – p) / SE
P(Z≥) (0.46 – 0.43)/0.07 = 0.43.
Step 4: Look up 0.43 in the z-table. The probability is 0.3336, or 33.36%.*
At a probability of 33.36%, it’s fairly likely that the proportion of women would have been 46% without a campaign. It’s unlikely that the marketing campaign made much of a difference.
*How I calculated this:
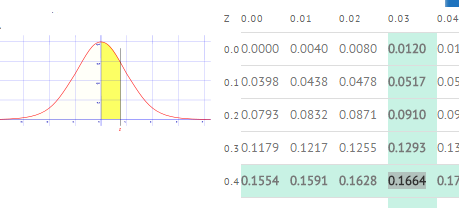
- I found a value of 0.1664 in the z-table. This is the area between the mean and z (in yellow).
- As I want the tail area (greater than z), I subtracted from 50% (i.e. half the curve). If I had been using a full z-table (from -3 to 3 standard deviations) I would have subtracted from 1.