Statistics Definitions > Residual Sum of Squares, Total and Explained
In ANOVA, Total SS is related to the total sum and explained sum with the following formula:
Total SS = Explained SS + Residual Sum of Squares. Watch the video for a definition and calculation steps for Total (TSS), Between (BSS), and Within (WSS):
Contents:
What is the Total Sum of Squares?
The Total SS (TSS or SST) tells you how much variation there is in the dependent variable.
Total SS = Σ(Yi – mean of Y)2.
Note: Sigma (Σ) is a mathematical term for summation or “adding up.” It’s telling you to add up all the possible results from the rest of the equation.
Sum of squares is a measure of how a data set varies around a central number (like the mean). You might realize by the phrase that you’re summing (adding up) squares—but squares of what? You’ll sometimes see this formula:
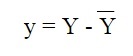
Other times you might see actual “squares”, like in this regression line:
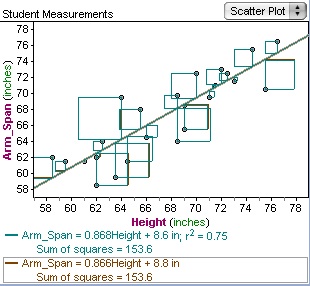
Squares of numbers, as in 42 and 102 can be represented with actual geometric squares (image courtesy of UMBC.edu):
So the square shapes you see on regression lines are just representations of square numbers, like 52 or 92. When you’re looking for a sum of squares, use the formula ; to find the actual number that represents a sum of squares. A diagram (like the regression line above) is optional, and can supply a visual representation of what you’re calculating.
Sample Question
Find the Sum of Sq. for the following numbers: 3,5,7.
Step 1: Find the mean by adding the numbers together and dividing by the number of items in the set:
(3 + 5 + 7) / 3 = 15 / 3 = 5
Step 2: Subtract the mean from each of your data items:
3 – 5 = -2
5 – 5 = 0
7 – 5 = 2
Step 3: Square your results from Step 3:
-2 x -2 = 4
0 x 0 = 0
2 x 2 = 4
Step 4: Sum (add up) all of your numbers:
4 + 4 + 0 = 8.
That’s it!
Sum of Sq. in ANOVA and Regression
As you can probably guess, things get a little more complicated when you’re calculating sum of squares in regression analysis or hypothesis testing. It is rarely calculated by hand; instead, software like Excel or SPSS is usually used to calculate the result for you.
For reference, sum of squares in regression uses the equation:
![]()
And in ANOVA it is calculated with:
The total SS = treatment sum of squares (SST) + SS of the residual error (SSE)
What is the Explained Sum of Squares?
The Explained SS tells you how much of the variation in the dependent variable your model explained.
Explained SS = Σ(Y-Hat – mean of Y)2.
What is the Residual Sum of Squares?
The residual sum of squares tells you how much of the dependent variable’s variation your model did not explain. It is the sum of the squared differences between the actual Y and the predicted Y:
Residual Sum of Squares = Σ e2
If all those formulas look confusing, don’t worry! It’s very, very unusual for you to want to use them. Finding the sum by hand is tedious and time-consuming. It involves a lot of subtracting, squaring and summing. Your calculations will be prone to errors, so you’re much better off using software like Excel to do the calculations. You won’t even need to know the actual formulas, as Excel works them behind the scenes.
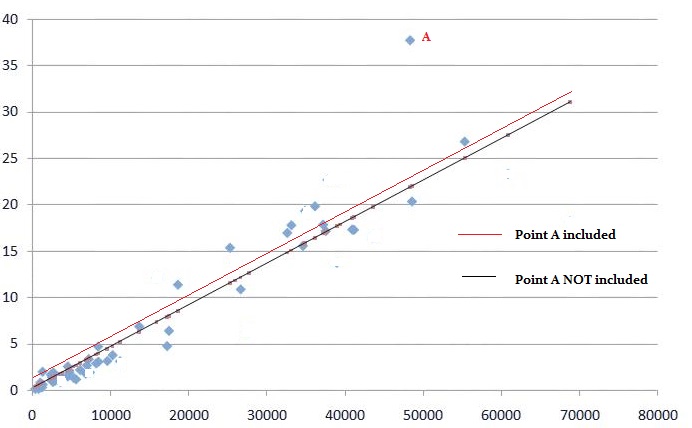
Uses
The smaller the residual sum of squares, the better your model fits your data; The greater the residual sum of squares, the poorer your model fits your data. A value of zero means your model is a perfect fit. One major use is in finding the coefficient of determination (R2). The coefficient of determination is a ratio of the explained sum of squares to the total sum of squares.
Sum of Squares Within
Within-group variation is reported in ANOVA output as SS(W) or which means Sum of Squares Within groups or SSW: Sum of Squares Within. It is intrinsically linked to between group variation (Sum of Squares between), variance difference caused by how groups interact with each other.
SSW is one component of total sum of squares (the other is between sum of squares). Within sum of squares represents the variation due to individual differences in the score. In other words, it’s the variation of individual scores around the group mean; it is variation not due to the treatment (Newsom, 2013).
References
Beyer, W. H. CRC Standard Mathematical Tables, 31st ed. Boca Raton, FL: CRC Press, pp. 536 and 571, 2002.
Kotz, S.; et al., eds. (2006), Encyclopedia of Statistical Sciences, Wiley.
Vogt, W.P. (2005). Dictionary of Statistics & Methodology: A Nontechnical Guide for the Social Sciences. SAGE.
Wheelan, C. (2014). Naked Statistics. W. W. Norton & Company