Statistics Definitions > Quantile
What is a Quantile?
The word “quantile” comes from the word quantity. In simple terms, a quantile is where a sample is divided into equal-sized, adjacent, subgroups (that’s why it’s sometimes called a “fractile“). It can also refer to dividing a probability distribution into areas of equal probability.
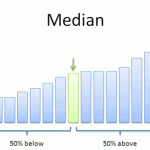
The median is a quantile; the median is placed in a probability distribution so that exactly half of the data is lower than the median and half of the data is above the median. The median cuts a distribution into two equal areas and so it is sometimes called 2-quantile.
Quartiles are also quantiles; they divide the distribution into four equal parts. Percentiles are quantiles that divide a distribution into 100 equal parts and deciles are quantiles that divide a distribution into 10 equal parts.
Some authors refer to the median as the 0.5 quantile, which means that the proportion 0.5 (half) will be below the median and 0.5 will be above it. This way of defining quartiles makes sense if you are trying to find a particular quantile in a data set (i.e. the median). Use the following formula to estimate the ith observation:
ith observation = q (n + 1)
where q is the quantile, the proportion below the ith value that you are looking for
n is the number of items in a data set
The above equation is a bit of a mind bender; it’s best explained with an example.
How to Find Quantiles?
Sample question: Find the number in the following set of data where 20 percent of values fall below it, and 80 percent fall above:
1 3 5 6 9 11 12 13 19 21 22 32 35 36 45 44 55 68 79 80 81 88 90 91 92 100 112 113 114 120 121 132 145 146 149 150 155 180 189 190
Step 1: Order the data from smallest to largest. The data in the question is already in ascending order.
Step 2: Count how many observations you have in your data set. this particular data set has 40 items.
Step 3: Convert any percentage to a decimal for “q”. We are looking for the number where 20 percent of the values fall below it, so convert that to .2.
Step 4: Insert your values into the formula:
ith observation = q (n + 1)
ith observation = .2 (40 + 1) = 8.2
Answer: The ith observation is at 8.2, so we round down to 8 (remembering that this formula is an estimate). The 8th number in the set is 13, which is the number where 20 percent of the values fall below it.
References
Beyer, W. H. CRC Standard Mathematical Tables, 31st ed. Boca Raton, FL: CRC Press, pp. 536 and 571, 2002.
Everitt, B. S.; Skrondal, A. (2010), The Cambridge Dictionary of Statistics, Cambridge University Press.
Klein, G. (2013). The Cartoon Introduction to Statistics. Hill & Wamg.
Vogt, W.P. (2005). Dictionary of Statistics & Methodology: A Nontechnical Guide for the Social Sciences. SAGE.