In statistics, the Q function Q(x) usually refers to the normal distribution function Φ(x). For other meanings, see Other Uses.
The Normal Distribution Q Function Φ(x)
The Q function is just one minus the cumulative distribution function (CDF) for the standardized normal distribution. In other words, it gives you the right tail area.
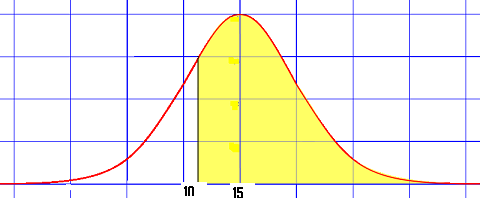
The CDF for the normal distribution gives you the probability that a normal random variable takes a value equal to or smaller than x. The Q function is the complement of this; In other words, it’s the probability a normal random variable takes a value greater than x.
As a formula:
Q(x) = 1 – CDF = P(X > x)
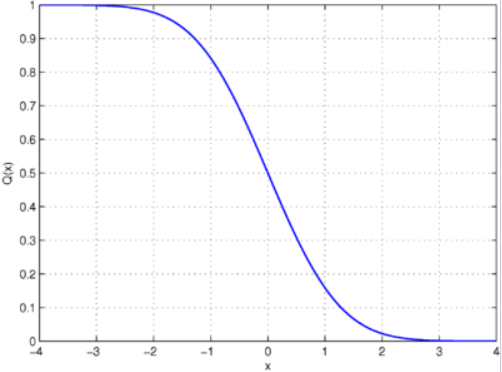
The plot starts with an area of 1, representing 100% probability. At the point on the far left of the bell curve, the right “tail” is actually the entire area of the curve.
Calculating the function by hand is relatively simple: find the CDF, and subtract from one. Some software programs find the Q function directly. For example, In MATLAB, the syntax is y = qfunc(x). If your software doesn’t, find the CDF and subtract from one.
Other Meanings
There are other meanings for the Q function, including:
- The conditional expected log-likelihood, used in calculating the E-step in the EM algorithm (see Gupta and Chen 2011 for an example),
- The none q, a special function used in the theory of elliptic functions.
- Q-analogs and Q-series, used in combinatorics and the study of functions.
- The q-products Qn, where n = 1,2,3.
- The partition function Q, used in statistical thermodynamics.
- The Marcum Q-function, which is used mainly in signal processing.
References
Gupta, M. & Chen, Y. (2011). Theory and Use of the EM Algorithm. Foundations and Trends in Signal Processing. Vol. 4, No. 3 (2010) 223–296. Retrieved December 6, 2017 from http://www.mayagupta.org/publications/EMbookGuptaChen2010.pdf