Contents (General):
- What is a Z-Score?
- Z Score Formulas.
- How to Calculate a Z-Score.
- More on Z scores and Standard Deviations.
- How is it Used in Real Life?
Contents (Technology):
- How To Find a Z-Score on the TI-89.
- How to Find a Z-Score in Excel.
- How to find a critical z-value on the TI-83.
- Z Scores in SPSS (New Window)
1. What is a Z-Score?
Watch the video to learn what a z-score is.
Simply put, a z-score (also called a standard score) gives you an idea of how far from the mean a data point is. But more technically it’s a measure of how many standard deviations below or above the population mean a raw score is.
A z-score can be placed on a normal distribution curve. Z-scores range from -3 standard deviations (which would fall to the far left of the normal distribution curve) up to +3 standard deviations (which would fall to the far right of the normal distribution curve). In order to use a z-score, you need to know the mean μ and also the population standard deviation σ.
Z-scores are a way to compare results to a “normal” population. Results from tests or surveys have thousands of possible results and units; those results can often seem meaningless. For example, knowing that someone’s weight is 150 pounds might be good information, but if you want to compare it to the “average” person’s weight, looking at a vast table of data can be overwhelming (especially if some weights are recorded in kilograms). A z-score can tell you where that person’s weight is compared to the average population’s mean weight.
2. Z Score Formulas
The Z Score Formula: One Sample
The basic z score formula for a sample is:
z = (x – μ) / σ
For example, let’s say you have a test score of 190. The test has a mean (μ) of 150 and a standard deviation (σ) of 25. Assuming a normal distribution, your z score would be:
- z = (x – μ) / σ
- = (190 – 150) / 25 = 1.6.
The z score tells you how many standard deviations from the mean your score is. In this example, your score is 1.6 standard deviations above the mean.
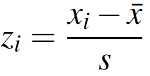 You may also see the z score formula shown to the left. This is exactly the same formula as z = x – μ / σ, except that x̄ (the sample mean) is used instead of μ (the population mean) and s (the sample standard deviation) is used instead of σ (the population standard deviation). However, the steps for solving it are exactly the same.
Z Score Formula: Standard Error of the Mean
When you have multiple samples and want to describe the standard deviation of those sample means (the standard error), you would use this z score formula:
z = (x – μ) / (σ / √n)
This z-score will tell you how many standard errors there are between the sample mean and the population mean.
Example problem: In general, the mean height of women is 65″ with a standard deviation of 3.5″. What is the probability of finding a random sample of 50 women with a mean height of 70″, assuming the heights are normally distributed?
- z = (x – μ) / (σ / √n)
- = (70 – 65) / (3.5/√50) = 5 / 0.495 = 10.1
The key here is that we’re dealing with a sampling distribution of means, so we know we have to include the standard error in the formula. We also know that 99% of values fall within 3 standard deviations from the mean in a normal probability distribution (see 68 95 99.7 rule). Therefore, there’s less than 1% probability that any sample of women will have a mean height of 70″.
Confused about when to use σ and when to use σ √n? See: Sigma / sqrt (n) — why is it used?
Back to Top
3. How to Calculate a Z-Score
You can easily calculate a z-score on a TI-83 calculator or in Excel. However, if you don’t have either, you can calculate it by hand.
Example question: You take the SAT and score 1100. The mean score for the SAT is 1026 and the standard deviation is 209. How well did you score on the test compared to the average test taker?
Step 1: Write your X-value into the z-score equation. For this example question the X-value is your SAT score, 1100.
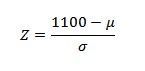
Step 2: Put the mean, μ, into the z-score equation.
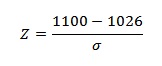
Step 3: Write the standard deviation, σ into the z-score equation.
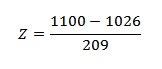
Step 4: Find the answer using a calculator:
(1100 – 1026) / 209 = .354. This means that your score was .354 std devs above the mean.
Step 5: (Optional) Look up your z-value in the z-table to see what percentage of test-takers scored below you. A z-score of .354 is .1368 + .5000* = .6368 or 63.68%.
*Why add .500 to the result? The z-table shown has scores for the RIGHT of the mean. Therefore, we have to add .500 for all of the area LEFT of the mean. For more examples of when to add (or subtract) .500, see several examples in: Area under a normal distribution curve.
4. Z scores and Standard Deviations
Technically, a z-score is the number of standard deviations from the mean value of the reference population (a population whose known values have been recorded, like in these charts the CDC compiles about people’s weights). For example:
- A z-score of 1 is 1 standard deviation above the mean.
- A score of 2 is 2 standard deviations above the mean.
- A score of -1.8 is -1.8 standard deviations below the mean.
A z-score tells you where the score lies on a normal distribution curve. A z-score of zero tells you the values is exactly average while a score of +3 tells you that the value is much higher than average.
5. How is it Used in Real Life?
You can use the z-table and the normal distribution graph to give you a visual about how a z-score of 2.0 means “higher than average”. Let’s say you have a person’s weight (240 pounds), and you know their z-score is 2.0. You know that 2.0 is above average (because of the high placement on the normal distribution curve), but you want to know how much above average is this weight?
The z-score in the center of the curve is zero. The z-scores to the right of the mean are positive and the z-scores to the left of the mean are negative. If you look up the score in the z-table, you can tell what percentage of the population is above or below your score. The table below shows a z-score of 2.0 highlighted, showing .9772 (which converts to 97.72%). If you look at the same score (2.0) of the normal distribution curve above, you’ll see it corresponds with 97.72%.
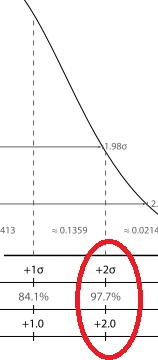
That tells you 97.72% of the population’s scores lie below that particular score and 100% – 97.72% = 2.28% of the scores lie above that score. A mere 2.28 of the population is above this person’s weight….probably a good indication they need to go on a diet!
Technology
1. How to Find a Z-Score on the TI-89
The TI-89 Titanium’s Stats/List Editor contains a simple menu where you can look up a Z Score in seconds. This section shows you how to find the z-score for a critical value in a left tail. The normal distribution curve is symmetrical, so this will also be the area in a right tail as well.
Not sure if your test is a left tailed or right tailed? See “Left Tailed Test or Right Tailed” to help you decide.
Note that you must have the Stats/List Editor installed to be able to make a TI-89 frequency distribution using these instructions.
Z Score TI 89: Steps
Example problem: Find the z score for α = .012 for a left-tailed test on a standard normal distribution curve.
Step 1: Press Apps, scroll to the Stats/List Editor, and press ENTER.
If you don’t see the Stats/List Editor, you can download it here. It’s an official TI app and you’ll need to transfer it to your calculator using the cable that originally came with your TI-89.
Step 2: Press F5 2 1, to get to the Inverse Normal screen.
Step 3: Enter .012 in the Area box.
Step 4: Enter 0 for the mean, μ and 1 for the standard deviation, σ.
Step 5: Press ENTER.
Step 6: Read the result: the calculator should state “Inverse = -2.25713“. This is your z score.
Tip: If you are given a mean and standard deviation, enter them in place of 0 and 1 in Step 4.
That’s how to find a z score on the TI 89!
2. How to Find a Z-Score in Excel
Z-Score in Excel: Overview
A z-score in Excel can quickly be calculated using a basic formula. The formula for calculating a z-score is
z = (x-μ) / σ,
where μ is the population mean and σ is the population standard deviation.
Note: if you don’t know the population standard deviation or the sample size is below 6, you should use a t-score instead of a z-score.
Z-Score in Excel: Steps
Watch the video or read the steps below:
Example question: You take the GRE and scored 650 in the verbal section of the test. Calculate a z-score in Excel to determine how good your score is compared to the general population of test takers. The population mean (μ) is 469 and the population standard deviation (σ) is 119.
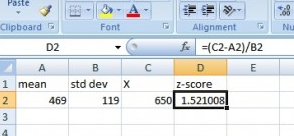
Step 1: Type the population mean into a blank cell. For this example, type “469” into cell A2. Optional: type the word “mean” as a column header in cell A1 so you remember what the value in cell A2 stands for.
Step 2: Enter the population standard deviation into a blank cell. For this example, type “119” into cell B2. Optional: type the words “standard deviation” as a column header in cell B1 so you remember what the value in cell B2 stands for.
Step 3: Type the X-value (in this example problem, X is your GRE score) into a blank cell. For this example, type “650” into cell C2. Optional: type the words “X” as a column header in cell B1 so you remember what the value in cell B2 stands for.
Step 4: Enter the following formula into an empty cell:
=(C2-A2)/B2
Step 5: Press “Enter.” The z-score will appear in cell D2: The z-score of 1.521008 in this example problem indicates your GRE score was 1.521008.
That’s it! You’ve found a z-score in Excel.
Tip: Once you’ve entered the formula once, you can use it over and over again. Just type a new mean, standard deviation and X value into the relevant boxes.
References
Base, C. (2018). Understanding Basic Statistics. Cengage Learning.
CDC. Anthropometric Reference Data for Children and Adults: United States, 2007–2010.
Salkind, N. (2016). Statistics for People Who (Think They) Hate Statistics: Using Microsoft Excel 2016 Fourth Edition. SAGE Publications.