Statistics Definitions > ANOVA
Contents:
- The ANOVA Test
- One Way ANOVA
- Two Way ANOVA
- What is MANOVA?
- What is Factorial ANOVA?
- How to run an ANOVA
- ANOVA vs. T Test
- Repeated Measures ANOVA
- Sphericity
- Related Articles
The ANOVA Test
An ANOVA test is a way to find out if survey or experiment results are significant. In other words, they help you to figure out if you need to reject the null hypothesis or accept the alternate hypothesis.
Basically, you’re testing groups to see if there’s a difference between them. Examples of when you might want to test different groups:
- A group of psychiatric patients are trying three different therapies: counseling, medication and biofeedback. You want to see if one therapy is better than the others.
- A manufacturer has two different processes to make light bulbs. They want to know if one process is better than the other.
- Students from different colleges take the same exam. You want to see if one college outperforms the other.
What Does “One-Way” or “Two-Way Mean?
One-way or two-way refers to the number of independent variables (IVs) in your Analysis of Variance test.
- One-way has one independent variable (with 2 levels). For example: brand of cereal,
- Two-way has two independent variables (it can have multiple levels). For example: brand of cereal, calories.
What are “Groups” or “Levels”?
Groups or levels are different groups within the same independent variable. In the above example, your levels for “brand of cereal” might be Lucky Charms, Raisin Bran, Cornflakes — a total of three levels. Your levels for “Calories” might be: sweetened, unsweetened — a total of two levels.
Let’s say you are studying if an alcoholic support group and individual counseling combined is the most effective treatment for lowering alcohol consumption. You might split the study participants into three groups or levels:
- Medication only,
- Medication and counseling,
- Counseling only.
Your dependent variable would be the number of alcoholic beverages consumed per day.
If your groups or levels have a hierarchical structure (each level has unique subgroups), then use a nested ANOVA for the analysis.
What Does “Replication” Mean?
It’s whether you are replicating (i.e. duplicating) your test(s) with multiple groups. With a two way ANOVA with replication , you have two groups and individuals within that group are doing more than one thing (i.e. two groups of students from two colleges taking two tests). If you only have one group taking two tests, you would use without replication.
Types of Tests.
There are two main types: one-way and two-way. Two-way tests can be with or without replication.
- One-way ANOVA between groups: used when you want to test two groups to see if there’s a difference between them.
- Two way ANOVA without replication: used when you have one group and you’re double-testing that same group. For example, you’re testing one set of individuals before and after they take a medication to see if it works or not.
- Two way ANOVA with replication: Two groups, and the members of those groups are doing more than one thing. For example, two groups of patients from different hospitals trying two different therapies.
One Way ANOVA
A one way ANOVA is used to compare two means from two independent (unrelated) groups using the F-distribution. The null hypothesis for the test is that the two means are equal. Therefore, a significant result means that the two means are unequal.
Examples of when to use a one way ANOVA
Situation 1: You have a group of individuals randomly split into smaller groups and completing different tasks. For example, you might be studying the effects of tea on weight loss and form three groups: green tea, black tea, and no tea.
Situation 2: Similar to situation 1, but in this case the individuals are split into groups based on an attribute they possess. For example, you might be studying leg strength of people according to weight. You could split participants into weight categories (obese, overweight and normal) and measure their leg strength on a weight machine.
Limitations of the One Way ANOVA
A one way ANOVA will tell you that at least two groups were different from each other. But it won’t tell you which groups were different. If your test returns a significant f-statistic, you may need to run an ad hoc test (like the Least Significant Difference test) to tell you exactly which groups had a difference in means.
Back to Top
How to run a One Way ANOVA in SPSS
Two Way ANOVA
A Two Way ANOVA is an extension of the One Way ANOVA. With a One Way, you have one independent variable affecting a dependent variable. With a Two Way ANOVA, there are two independents. Use a two way ANOVA when you have one measurement variable (i.e. a quantitative variable) and two nominal variables. In other words, if your experiment has a quantitative outcome and you have two categorical explanatory variables, a two way ANOVA is appropriate.
For example, you might want to find out if there is an interaction between income and gender for anxiety level at job interviews. The anxiety level is the outcome, or the variable that can be measured. Gender and Income are the two categorical variables. These categorical variables are also the independent variables, which are called factors in a Two Way ANOVA.
The factors can be split into levels. In the above example, income level could be split into three levels: low, middle and high income. Gender could be split into three levels: male, female, and transgender. Treatment groups are all possible combinations of the factors. In this example there would be 3 x 3 = 9 treatment groups.
Main Effect and Interaction Effect
The results from a Two Way ANOVA will calculate a main effect and an interaction effect. The main effect is similar to a One Way ANOVA: each factor’s effect is considered separately. With the interaction effect, all factors are considered at the same time. Interaction effects between factors are easier to test if there is more than one observation in each cell. For the above example, multiple stress scores could be entered into cells. If you do enter multiple observations into cells, the number in each cell must be equal.
Two null hypotheses are tested if you are placing one observation in each cell. For this example, those hypotheses would be:
H01: All the income groups have equal mean stress.
H02: All the gender groups have equal mean stress.
For multiple observations in cells, you would also be testing a third hypothesis:
H03: The factors are independent or the interaction effect does not exist.
An F-statistic is computed for each hypothesis you are testing.
Assumptions for Two Way ANOVA
- The population must be close to a normal distribution.
- Samples must be independent.
- Population variances must be equal (i.e. homoscedastic).
- Groups must have equal sample sizes.
What is MANOVA?
MANOVA is just an ANOVA with several dependent variables. It’s similar to many other tests and experiments in that it’s purpose is to find out if the response variable (i.e. your dependent variable) is changed by manipulating the independent variable. The test helps to answer many research questions, including:
- Do changes to the independent variables have statistically significant effects on dependent variables?
- What are the interactions among dependent variables?
- What are the interactions among independent variables?
MANOVA Example
Suppose you wanted to find out if a difference in textbooks affected students’ scores in math and science. Improvements in math and science means that there are two dependent variables, so a MANOVA is appropriate.
An ANOVA will give you a single (univariate) f-value while a MANOVA will give you a multivariate F value. MANOVA tests the multiple dependent variables by creating new, artificial, dependent variables that maximize group differences. These new dependent variables are linear combinations of the measured dependent variables.
Interpreting the MANOVA results
If the multivariate F value indicates the test is statistically significant, this means that something is significant. In the above example, you would not know if math scores have improved, science scores have improved (or both). Once you have a significant result, you would then have to look at each individual component (the univariate F tests) to see which dependent variable(s) contributed to the statistically significant result.
Advantages and Disadvantages of MANOVA vs. ANOVA
Advantages
- MANOVA enables you to test multiple dependent variables.
- MANOVA can protect against Type I errors.
Disadvantages
- MANOVA is many times more complicated than ANOVA, making it a challenge to see which independent variables are affecting dependent variables.
- One degree of freedom is lost with the addition of each new variable.
- The dependent variables should be uncorrelated as much as possible. If they are correlated, the loss in degrees of freedom means that there isn’t much advantages in including more than one dependent variable on the test.
Reference:
SFSU. Retrieved April 18, 2022 from: http://online.sfsu.edu/efc/classes/biol710/manova/MANOVAnewest.pdf
What is Factorial ANOVA?
A factorial ANOVA is an Analysis of Variance test with more than one independent variable, or “factor“. It can also refer to more than one Level of Independent Variable. For example, an experiment with a treatment group and a control group has one factor (the treatment) but two levels (the treatment and the control). The terms “two-way” and “three-way” refer to the number of factors or the number of levels in your test. Four-way ANOVA and above are rarely used because the results of the test are complex and difficult to interpret.
- A two-way ANOVA has two factors (independent variables) and one dependent variable. For example, time spent studying and prior knowledge are factors that affect how well you do on a test.
- A three-way ANOVA has three factors (independent variables) and one dependent variable. For example, time spent studying, prior knowledge, and hours of sleep are factors that affect how well you do on a test
Factorial ANOVA is an efficient way of conducting a test. Instead of performing a series of experiments where you test one independent variable against one dependent variable, you can test all independent variables at the same time.
Variability
In a one-way ANOVA, variability is due to the differences between groups and the differences within groups. In factorial ANOVA, each level and factor are paired up with each other (“crossed”). This helps you to see what interactions are going on between the levels and factors. If there is an interaction then the differences in one factor depend on the differences in another.
Let’s say you were running a two-way ANOVA to test male/female performance on a final exam. The subjects had either had 4, 6, or 8 hours of sleep.
- IV1: SEX (Male/Female)
- IV2: SLEEP (4/6/8)
- DV: Final Exam Score
A two-way factorial ANOVA would help you answer the following questions:
- Is sex a main effect? In other words, do men and women differ significantly on their exam performance?
- Is sleep a main effect? In other words, do people who have had 4,6, or 8 hours of sleep differ significantly in their performance?
- Is there a significant interaction between factors? In other words, how do hours of sleep and sex interact with regards to exam performance?
- Can any differences in sex and exam performance be found in the different levels of sleep?
Assumptions of Factorial ANOVA
- Normality: the dependent variable is normally distributed.
- Independence: Observations and groups are independent from each other.
- Equality of Variance: the population variances are equal across factors/levels.
How to run an ANOVA
These tests are very time-consuming by hand. In nearly every case you’ll want to use software. For example, several options are available in Excel:
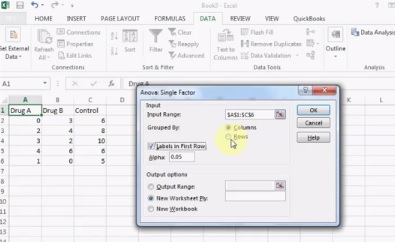
ANOVA tests in statistics packages are run on parametric data. If you have rank or ordered data, you’ll want to run a non-parametric ANOVA (usually found under a different heading in the software, like “nonparametric tests“).
Steps
It is unlikely you’ll want to do this test by hand, but if you must, these are the steps you’ll want to take:
- Find the mean for each of the groups.
- Find the overall mean (the mean of the groups combined).
- Find the Within Group Variation; the total deviation of each member’s score from the Group Mean.
- Find the Between Group Variation: the deviation of each Group Mean from the Overall Mean.
- Find the F statistic: the ratio of Between Group Variation to Within Group Variation.
ANOVA vs. T Test
A Student’s t-test will tell you if there is a significant variation between groups. A t-test compares means, while the ANOVA compares variances between populations.
You could technically perform a series of t-tests on your data. However, as the groups grow in number, you may end up with a lot of pair comparisons that you need to run. ANOVA will give you a single number (the f-statistic) and one p-value to help you support or reject the null hypothesis.
Back to Top
Repeated Measures (Within Subjects) ANOVA
A repeated measures ANOVA is almost the same as one-way ANOVA, with one main difference: you test related groups, not independent ones.
It’s called Repeated Measures because the same group of participants is being measured over and over again. For example, you could be studying the cholesterol levels of the same group of patients at 1, 3, and 6 months after changing their diet. For this example, the independent variable is “time” and the dependent variable is “cholesterol.” The independent variable is usually called the within-subjects factor.
Repeated measures ANOVA is similar to a simple multivariate design. In both tests, the same participants are measured over and over. However, with repeated measures the same characteristic is measured with a different condition. For example, blood pressure is measured over the condition “time”. For simple multivariate design it is the characteristic that changes. For example, you could measure blood pressure, heart rate and respiration rate over time.
Reasons to use Repeated Measures ANOVA
- When you collect data from the same participants over a period of time, individual differences (a source of between group differences) are reduced or eliminated.
- Testing is more powerful because the sample size isn’t divided between groups.
- The test can be economical, as you’re using the same participants.
Assumptions for Repeated Measures ANOVA
The results from your repeated measures ANOVA will be valid only if the following assumptions haven’t been violated:
- There must be one independent variable and one dependent variable.
- The dependent variable must be a continuous variable, on an interval scale or a ratio scale.
- The independent variable must be categorical, either on the nominal scale or ordinal scale.
- Ideally, levels of dependence between pairs of groups is equal (“sphericity”). Corrections are possible if this assumption is violated.
One Way Repeated Measures ANOVA in SPSS: Steps
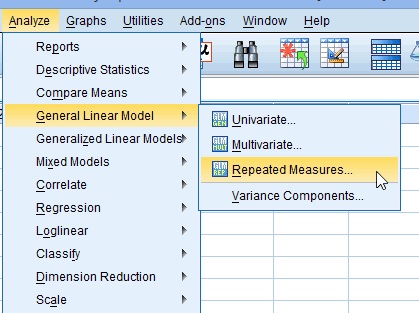
Step 1: Click “Analyze”, then hover over “General Linear Model.” Click “Repeated Measures.”
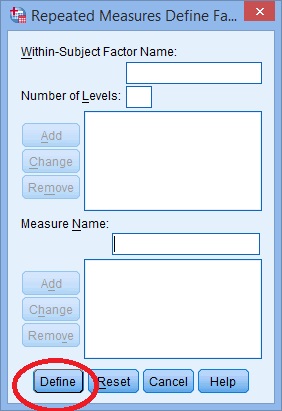
Step 2: Replace the “factor1” name with something that represents your independent variable. For example, you could put “age” or “time.”
Step 3: Enter the “Number of Levels.” This is how many times the dependent variable has been measured. For example, if you took measurements every week for a total of 4 weeks, this number would be 4.
Step 4: Click the “Add” button and then give your dependent variable a name.
Step 5: Click the “Add” button. A Repeated Measures Define box will pop up. Click the “Define” button.
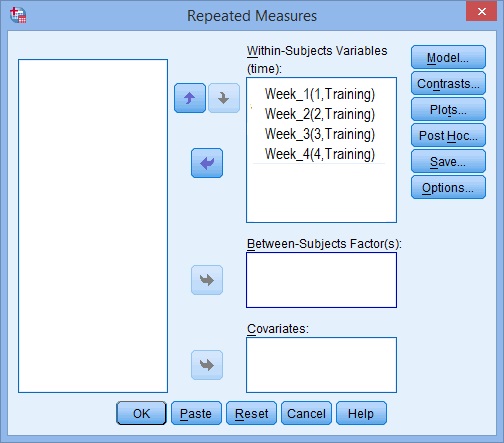
Step 6: Use the arrow keys to move your variables from the left to the right so that your screen looks similar to the image below:
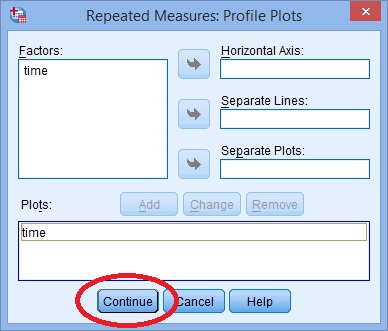
Step 7: Click “Plots” and use the arrow keys to transfer the factor from the left box onto the Horizontal Axis box.
Step 8: Click “Add” and then click “Continue” at the bottom of the window.
Step 9: Click “Options”, then transfer your factors from the left box to the Display Means for box on the right.
Step 10: Click the following check boxes:
- Compare main effects.
- Descriptive Statistics.
- Estimates of Effect Size.
Step 11: Select “Bonferroni” from the drop down menu under Confidence Interval Adjustment.
Step 12: Click “Continue” and then click “OK” to run the test.
Back to Top
Sphericity
In statistics, sphericity (ε) refers to Mauchly’s sphericity test, which was developed in 1940 by John W. Mauchly, who co-developed the first general-purpose electronic computer.
Definition
Sphericity is used as an assumption in repeated measures ANOVA. The assumption states that the variances of the differences between all possible group pairs are equal. If your data violates this assumption, it can result in an increase in a Type I error (the incorrect rejection of the null hypothesis).
It’s very common for repeated measures ANOVA to result in a violation of the assumption. If the assumption has been violated, corrections have been developed that can avoid increases in the type I error rate. The correction is applied to the degrees of freedom in the F-distribution.
Mauchly’s Sphericity Test
Mauchly’s test for sphericity can be run in the majority of statistical software, where it tends to be the default test for sphericity. Mauchly’s test is ideal for mid-size samples. It may fail to detect sphericity in small samples and it may over-detect in large samples.
If the test returns a small p-value (p ≤.05), this is an indication that your data has violated the assumption. The following picture of SPSS output for ANOVA shows that the significance “sig” attached to Mauchly’s is .274. This means that the assumption has not been violated for this set of data.
You would report the above result as “Mauchly’s Test indicated that the assumption of sphericity had not been violated, χ2(2) = 2.588, p = .274.”
If your test returned a small p-value, you should apply a correction, usually either the:
When ε ≤ 0.75 (or you don’t know what the value for the statistic is), use the Greenhouse-Geisser correction.
When ε > .75, use the Huynh-Feldt correction.
Related Articles
Grand mean
ANOVA vs Regression
References
Blokdyk, B. (2018). Ad Hoc Testing. 5STARCooks
Miller, R. G. Beyond ANOVA: Basics of Applied Statistics. Boca Raton, FL: Chapman & Hall, 1997
Image: UVM. Retrieved December 4, 2020 from: https://www.uvm.edu/~dhowell/gradstat/psych341/lectures/RepeatedMeasures/repeated1.html