Probability >
Contents:
- What is Predictive Analytics?
- Real Life Examples
- Analytical Tools
- Software for Predictive Analytics
- Tips for Making Good Predictions
What is Predictive Analytics?
Predictive analytics is a way to predict future events based on past behavior. It’s a combination of statistics and data mining; Tools from both areas are applied to existing large data sets to:
- Identify patterns and trends.
- Build models to predict what might happen in the future.
- Create visual representations of the information.
- Generate other useful information.
One of the primary goals of predictive analytics is to assign a probability (predictive score) for the likelihood that an organizational unit (e.g. a customer, vehicle, or component) will behave a certain way. For example, a manufacturer might want to know the probability a customer will purchase a second product, or a computer security company might want to know the probability that unusual network traffic is a hacking attempt. It is used to predict behavior and assess risk over a wide variety of disciplines, including:
- Actuarial science,
- Banking and other financial services,
- Child protection,
- Crime Prevention,
- Healthcare,
- Insurance,
- Marketing,
- Retail,
- Telecommunications,
- Travel.
Although the term predictive is usually taken as meaning “in the future”, predictive analytics can also be used to analyze past and present behavior. For example, it can be used to analyze crime scene data to generate a profile for the most likely suspects.
Major Fields
Predictive Analytics is split into two general areas–marketing analytics and healthcare analytics. However, the techniques can be used by just about organization with access to “Big Data.”
- Marketing Analytics
Marketing analytics lets you know how your company or business is really performing. It uses metrics like:- Customer lifetime value (CLTV): Predicts how much a customer will buy over time.
- Marketing attribution: Identifies user actions (called “events” or “touchpoints”) that contribute in some manner to a certain outcome.
- Next best offer or product recommendation: predicts what your customer is most likely to purchase next.
- Overall marketing effectiveness: measures how effective a marketer’s go to market strategy is over both the short-term and long-term.
- Return on Investment (ROI): Measures the benefit from an investment.
- Quarterly or yearly sales forecasts: Predicts how much income your company is likely to generate.
- Healthcare Analytics
Healthcare analytics encompasses a wide range of data generated by health care systems, professionals, and patients. A multi-level analytics platform covers a multi-level area from patient care to hospital management. For example, it may include keeping and analyzing:- Patient wellness management records,
- Data on mass customization of care,
- Biometrics usage (includes technologies that can tell people apart by their facial structure, fingerprints, palm prints, retina scan, or voice), genomic data (e.g. results from genetic testing) and family history data,
- Financial records (e.g. costs, insurance reimbursements, revenue and supply chain),
- Patient satisfaction surveys.
Predictive Analytics Real Life Examples
Banking: Perhaps the most well known application of predictive analytics is the credit score, where data about consumers past and current financial behavior is used to determine their likelihood of making timely payments in the future.
 Sports: Billy Bean (made famous by Brad Pitt in the movie Moneyball) used predictive analytics to dramatically improve his low-performing Major League Baseball Team, the Oakland A’s. Despite their low budget, it is now one of the highest performing teams.
Federal Government: Predictive analytics can be used to uncover health insurance billing fraud, including Medicaid fraud. A list of outliers from big data–for example the physicians who are many standard deviations away from their peers with billing practices–is used to answer the question Is this type of Medicaid billing suspicious? It is also used to take existing cases of fraud and build models to identify more potential fraudulent cases.
Power plants, including wind power installations, use predictive analytics to reduce unexpected equipment failures, reduce maintenance costs and improve power availability.
Cybersecurity is a growing concern. Real-time analytics examines network traffic to identify patterns that may indicate fraud, computer-software vulnerability or other threats.
Back to top
Analytical Tools
A wide range of statistical tools are used in predictive analytics. The most common are:
- Discrete choice models: Offer choices between events. The choice can be as simple as yes/no: complete a graduate degree/don’t complete a graduate degree. Multiple choices are also possible: buy/sell/trade.
- Regression Analysis: an umbrella term for fitting data to a model that can be used to predict future trends and values. Some specific regression techniques:
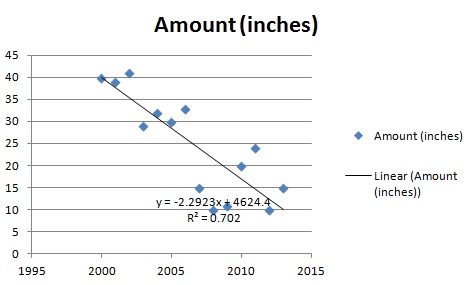
- Simple Linear regression: fits data to a straight line.
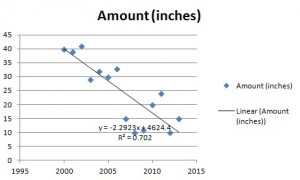
A simple linear regression plot for amount of rainfall. - Logistic regression (logit model): Almost identical to linear regression. However, linear regression uses two measurement variables and logistic regression uses one measurement and one nominal variable.
- Multinomial logistic regression: Used when you have a categorical dependent variable with two or more unordered levels (i.e. two or more discrete outcomes). It is practically identical to logistic regression, except that you have multiple possible outcomes instead of just one.
- Probit regression: Regression for binary outcome variables. Binary outcome variables are dependent variables with two possibilities, like yes/no, positive test result/negative test result or single/not single.
- Simple Linear regression: fits data to a straight line.
- Time series models: Display values against time. For example, company growth over 12 months or stock prices for the last week.
- Survival analysis: A model for time until a certain “event.” The event is sometimes, but not always, death.
- Classification and regression trees (CART): Machine-learning procedures for making prediction models from data.
- Decision Trees: a very specific type of probability tree that enables you to make a decision about some kind of process. For example, you might want to choose between manufacturing item A or item B, or investing in choice 1, choice 2, or choice 3.
- Multivariate adaptive regression splines: A tool for modeling high dimensional data.
Software for Predictive Analytics
Predictive analytics software uses multiple variables to create reliable forecasts for future behavior. As well as incorporating some of the relatively simple procedures listed in the above section, PA software employs advanced algorithms, data mining and machine learning to generate probabilities for specific behavior. According to TechnologyAdvice.com, some of the most popular software options include:
- Board: a good, all round package well-suited for banking,
insurance, logistics, and manufacturing. - Everstring: Mines your business data and builds matching customer segments, with probabilities for those accounts and visitors that are most likely to convert.
- Halo: Industry specific analytic tool for supply chain management.
- IBM SPSS: Powerful, all-round tool for generating anything from simple regression models to models that incorporate natural language processing, linguistic technology, and advanced AI systems.
- Infer: Another data mining tool for businesses which identifies customers and accounts with a high probability of converting.
- Radius: Focuses on business-to-business marketing.
- Rapid Miner Studio: Built specifically for Data Scientists.
- SAP HANA: general purpose business analytics platform that uses R-compatible code (R is a popular, free, statistics package).
- SAS Advanced Analytics: One of the PA giants, with about one third of the PA software pie.
- Statistica Decisioning Platform: general purpose software that historically has focused on fraud and risk models for financial institutions and the insurance industry.
Tips for Making Good Predictions
- Get good data,
- Make sure your data is current,
- Make sure your data is complete,
- Hire an analytics professional.
1. Get good data
Your predictions are only going to be as good as the data it’s based on. If you haven’t already done so, start collecting electronic data from sales, purchase orders, invoicing, and other relevant business data. Collect information from social networking, Google Analytics, Google Search Console and any other business-specific sources. If there are missing values or outliers (very large or very small data points), you’ll need to take care of those before you can run analytics. Missing values can be handled by entering zeros or using the mean or a value from the next largest (or smallest) data point. If you have the statistical background, you might want to consider a more statistically sound technique for filling in the blanks, like Multiple Imputations. Outliers can be trimmed , Winsorized, or omitted entirely. You can also consider treating them as missing values and replacing them. If you do remove outliers, run regression twice: once with the outlier and once without.
2. Make sure your data is complete
The 2007-2008 mortgage crisis is a prime example of what happens when data is incomplete. As far as the remortgage industry was concerned, it was using old data on how likely people were to pay mortgages back. In fact, the third-party software that the lenders were using was focused more on when mortgages were likely to be paid back, rather than when they were likely to default (Glowacki & Wunder). As lending practices changed (i.e. more sub-prime mortgages were made), the old data meant that the algorithms failed to keep up with the times.
3. Make sure your data is current
Out of date information is just as unreliable as incomplete data. Thomas Davenport, writing for Harvard Business Review used Netflix as an example of how data can completely change over time. In the early days of the internet, users tended to be younger and more tech-savvy. As the internet grew, everyone is using it. The old data that Netflix collected in its infancy had to be completely reworked.
4. Hire an Analytics Professional
Understanding how to perform regression analysis requires a fairly deep understanding of statistics. As a simple example, if you didn’t know that you should deal with outliers from data before performing regression, your models are going to be way off. Other assumptions and conditions for regression to work properly:
- The Quantitative Data Condition. Basically, your data has to be numbers, not categories, names, addresses or some other qualitative data type.
- The Straight Enough Condition (or “linearity”). This condition says that — assuming you’re running a linear regression — a scatter plot of your data should fit a line. A regression analysis will give you a result, and if you haven’t correctly fitted the model to the data, that regression line could be way off.
- Independence of Errors: If you don’t have random errors, you can’t run regression as your predictions won’t be accurate.
- Homoscedasticity: Make sure your scatter plot doesn’t look like a cone. That is a sign your data points are influencing each other. If so, regression is a no-go.
- Normality of Error Distribution: Your data points should be normally distributed around the regression line.
If you’re comfortable with statistics, great. If not, you’ll want to hire, at a minimum, a statistical consultant.
References:
Blomberg, J. Predictive Analytics: Turning Your Data into Intelligence. Article posted on Michigan.gov. Retrieved August 28, 2017 from: https://www.michigan.gov/documents/dit/4_SAS_presentation_267692_7.pdf
Davenport, Thomas. A Predictive Analytics Primer. Published online in Harvard Business Review. Retrieved August 28, 2017 from: https://hbr.org/2014/09/a-predictive-analytics-primer
Glowacki & Wunder. Prisoners of The Data: The Mortgage Industry and Predictive Modeling. Retrieved August 28, 2017 from: http://www.milliman.com/uploadedFiles/insight/2013/prisoners-of-the-data.pdf
The Health Catalyst. (2016). Healthcare Analytics Adoption Model. Retrieved August 28, 2017 from: https://www.healthcatalyst.com/healthcare-analytics-adoption-model/
MyFico. What is a Credit Score? Retrieved August 28, 2017 from: http://www.myfico.com/credit-education/credit-scores/
National Renewable Energy Lab. Wind Power. Retrieved October 3, 2014 from: http://www.nrel.gov/wind/pdfs/day1_sessionii_01_ge_intelligent_platforms_walleck.pdf
SAS. Marketing Analytics. Retrieved August 28, 2017 from: https://www.sas.com/en_us/insights/marketing/marketing-analytics.html
The Sentinel Watch. (2017). Biometrics as a Security Measure in Health Care. Retrieved August 28, 2017 from: http://www.americansentinel.edu/blog/2014/01/08/biometrics-as-a-security-measure-in-health-care-2/
TechnologyAdvice.com. Top 10 Predictive Analytics Tools, By Category. Retrieved August 2017 from: http://technologyadvice.com/blog/information-technology/top-predictive-analytics-tools/
Wikipedia. Billy Beane. Retrieved August 2017 from: https://en.wikipedia.org/wiki/Billy_Beane