1. What are Critical Values?
A critical value is a line on a graph that splits the graph into sections. One or two of the sections is the “rejection region“; if your test value falls into that region, then you reject the null hypothesis.
Critical values come in all shapes and sizes, but the one you’ll come across first in statistics is the critical value of Z.
Note: A critical number, used in calculus, is not the same thing as a critical value. Critical numbers are used in calculus to find points where a graph changes from increasing to decreasing, or vice-versa.
2.Critical Values of Z
The critical value of z is term linked to the area under the standard normal model. Critical values can tell you what probability any particular data point will have.
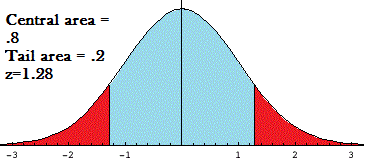
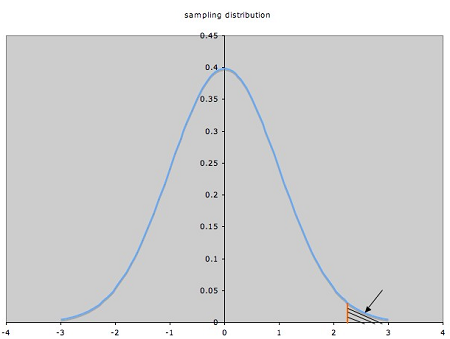
The above graph of the normal distribution curve shows a critical value of 1.28. The graph has two parts:
- Central region: The z-score is equal to the number of standard deviations from the mean. A score of 1.28 indicates that the variable is 1.28 standard deviations from the mean. If you look in the z-table for a z of 1.28, you’ll find the area is .3997. This is the region to the right of the mean, so you’ll double it to get the area of the entire central region: .3997*2 = .7994 or about 80 percent.

- Tail region: The area of the tails (the red areas) is 1 minus the central region. In this example, 1-.8 = .20, or about 20 percent. The tail regions are sometimes calculated when you want to know how many variables would be less than or more than a certain figure.

A critical value of z is sometimes written as za, where the alpha level, a, is the area in the tail. For example, z.10 = 1.28.
When are Critical values of z used?
A critical value of z (Z-score) is used when the sampling distribution is normal, or close to normal. Z-scores are used when the population standard deviation is known or when you have larger sample sizes. While the z-score can also be used to calculate probability for unknown standard deviations and small samples, in real life you’ll probabably use the t distribution to calculate these probabilities. That’s because you often don’t know the population variance (which is a requirement for using the z test).
See also: T Critical Value.
Other uses of z-scores
Every statistic has a probability, and every probability calculated for a sample has a margin of error. The critical value of z can also be used to calculate the margin of error.
- Margin of error = Critical value * Standard deviation of the statistic.
- Margin of error = Critical value * Standard error of the sample.
3. Find Critical Values in Any Tail
Need help? Check out our tutoring page!
How you look up a critical value is very straightforward as long as you know if you have a left tailed test or right tailed test (or potentially, both).
A. Find a critical value for a confidence level
Example question: Find a critical value for a 90% confidence level (Two-Tailed Test).
Step 1: Subtract the confidence level from 100% to find the α level: 100% – 90% = 10%.
Step 2: Convert Step 1 to a decimal: 10% = 0.10.
Step 3: Divide Step 2 by 2 (this is called “α/2”).
0.10 = 0.05. This is the area in each tail.
Step 4: Subtract Step 3 from 1 (because we want the area in the middle, not the area in the tail):
1 – 0.05 = .95.
Step 5: Look up the area from Step in the z-table. The area is at z=1.645. This is your critical value for a confidence level of 90%.
B. Common confidence levels and their critical values
You don’t have to perform the above calculations every time. This list of z- critical values and their associated confidence levels were calculated using the above steps:
| Confidence Level | Two Sided CV | One Sided CV |
| 90% | 1.64 | 1.28 |
| 95% | 1.96 | 1.65 |
| 99% | 2.58 | 2.33 |