Probability Distributions > PERT Distribution
What is the PERT Distribution?
The PERT distribution (also called the beta-PERT or three-point estimation technique) is a smooth version of the uniform distribution or triangular distribution. It is defined by:
- The minimum: the smallest value in a set. Can be any real number.
- The maximum: the largest value in a set. Can be any real number.
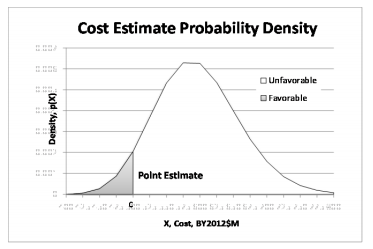
- The mode(c), the most common number in a set; this tells you where the peak of the distribution lies on the horizontal (x) axis. Can be any real number, but must be larger than the minimum and smaller than the maximum. In more technical terms, that’s min < c < max.
- An optional shape parameter, λ. This must be a non-negative real number.
The quantities min, max and mode must share the same unit dimensions (e.g. length, weight, cost) while λ is a dimensionless quantity (in other words, it’s just a number).
Sometimes the letters α, β and m are used, where:
- α is the minimum,
- β is the maximum,
- m is the mode.
The mean(average) for the PERT distribution is:
μ = (a + 4m + b) / 6.
This is a weighted mean, as it takes into account the maximum and minimum estimates for the project.
The standard deviation(σ) is given by:
σ = (β – α) / 6.
The PERT distribution produces a bell-shaped curve that is nearly normal. It is essentially a Beta Distribution that has been extended to the maximum and minimum and given strict definitions for the mean and variance (a technique called “reparameterization”).
Uses
The PERT Distribution was originally developed in the 1950s for the Polaris weapon system to calculate a probable time frame for completion of the project based on optimistic, pessimistic, and mode likely time frames. Nowadays, it is used for project completion time analysis in Program Evaluation and Review Technique(PERT). PERT is a modeling technique to estimate completion time or other desired event, bases on best estimates for the minimum, maximum, and most likely values for the event.
One major drawback with using PERT is that it’s a Utopian model that assumes you can place infinite resources where they will benefit completion time the most. In the real world, this is usually not possible. As such, relying on the PERT model alone can result in unrealistic expectations for management and workers.
Reference:
NASA. Retrieved July 15, 2016 from: http://www.nasa.gov/pdf/741989main_Analytic%20Method%20for%20Risk%20Analysis%20-%20Final%20Report.pdf.