What is an NP Chart?
An NP chart allows a researcher to keep track of whether a measurement process is within bounds or ‘out of control’. It records the number of non conforming units or defective instances in the measurement process.
The data it records is simple, binary data: nonconforming vs. conforming, fail vs. pass.
The NP chart is very similar to the p-chart. However, an NP chart plots the number of items while the p-chart plots proportions of items.
Reading an NP chart
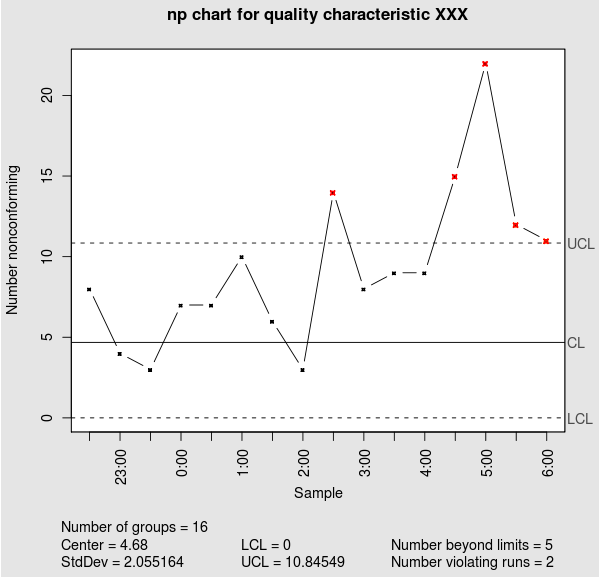
The vertical (Y) axis of an NP chart will typically tell the number of defectives or nonconforming instances in each subgroup, and the horizontal axis carries the sub group designations. Sub-groups are often time sequences (for instances, daily production in a factory). They should be equally sized, and ideally are large enough that they generally contain a few defective items.
After an initial period during which the process is known to be ‘within control’, control limits are calculated and represented on the graph as horizontal lines. They are calculated as:
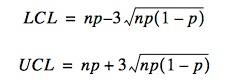
Where:
- n = the number of items,
- p = proportion of defective items.
- The lower control line is bounded by 0.
These control lines allow us to see immediately when future measurements point to a process that has gone out of control and is producing too many defects.
We use NP charts to monitor whether or not our process is predictable and stable, or whether it meets standards. This makes them a key tool in statistical quality control, such as is routine in manufactories.
References
- Heckert & Filliben. Graphics Commands: NP Control Chart. Dataplot Reference Manual, Volume 1, Chapter 2. Retrieved from https://www.itl.nist.gov/div898/software/dataplot/refman1/ch2/np_cont.pdf on May 13, 2018
- NP Charts. NCSS Statistical Software, Chapter 257. Retrieved from https://ncss-wpengine.netdna-ssl.com/wp-content/themes/ncss/pdf/Procedures/NCSS/NP_Charts.pdf on May 13, 2018.
- McNeese, Bill. np Control Charts. SPC for Excel. Retrieved from https://www.spcforexcel.com/knowledge/attribute-control-charts/np-control-charts on May 13, 2018.