You may want to read this article first: What is a Bin?
What is a Midpoint or Class Mark?
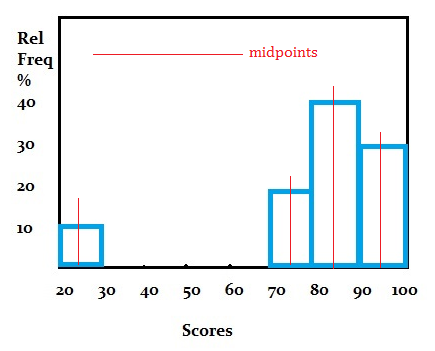
The class midpoint (or class mark) is a specific point in the center of the bins (categories) in a frequency distribution table; It’s also the center of a bar in a histogram.
Watch the video to find out how to calculate class marks / midpoints:
A midpoint is defined as the average of the upper and lower class limits. The lower class limit is the lowest value in a bin (a particular category); The upper class limits are the highest values that can be in the bin.
All members of a class are represented by their class marks when calculating most statistics for a frequency distribution table.
Calculating the Midpoint
You need to know the class limits for your data in order to calculate the midpoint. If you don’t know how to find class limits, see the steps in: How to make a frequency distribution table.
Example problem: Find the midpoint for class limits of 180 & 199.
The average of the class limits is (180 + 199) / 2 = 189.5. This is your midpoint.
You might see the class mark defined as the average of the class boundaries as well. You’ll get the same result. The same bin might have class boundaries of 179.5, 199.5, giving (179.5 + 199.5) / 2 = 189.5.
What if I have open-ended classes?
For open classes (i.e. classes that don’t have an upper limit or a lower limit), in most cases you can assume those have the same width as the other classes when doing your calculations. In an elementary statistics class, it’s highly unlikely your instructor will throw you a curve ball by creating an unusually wide open-ended class.
However, if you’re working with real-world data—perhaps from a graduate study or work-related study— you may need to use your best judgment when it comes to the midpoint for open classes. If the open class is extremely large, or extremely small, your best guess might be better than a calculated midpoint (Hammerman, R. et. al, 2012).
What are Class Boundaries?
Class boundaries are the data values which separate classes. They are not part of the classes or the dataset.
- The lower class boundary of a class is defined as the average of the lower limit of the class in question and the upper limit of the previous class.
- The upper class boundary is defined as average of the upper limit of the class in question and the lower limit of the next class.
References
Beyer, W. H. CRC Standard Mathematical Tables, 31st ed. Boca Raton, FL: CRC Press, pp. 536 and 571, 2002.
Agresti A. (1990) Categorical Data Analysis. John Wiley and Sons, New York.
Kotz, S.; et al., eds. (2006), Encyclopedia of Statistical Sciences, Wiley.
Lindstrom, D. (2010). Schaum’s Easy Outline of Statistics, Second Edition (Schaum’s Easy Outlines) 2nd Edition. McGraw-Hill Education