Statistics Definitions > Median Absolute Deviation
What is the Median Absolute Deviation
The median absolute deviation(MAD) is a robust measure of how spread out a set of data is. The variance and standard deviation are also measures of spread, but they are more affected by extremely high or extremely low values and non normality. If your data is normal, the standard deviation is usually the best choice for assessing spread. However, if your data isn’t normal, the MAD is one statistic you can use instead.
The Interquartile Range is similar to the MAD, and is a simpler statistic. However, it’s less robust.
The MAD is defined as:
MAD = median(|Yi – median(Yi|)
The formula is a variation of the mean absolute deviation formula (see the mean absolute deviation article for more help in solving the formula). It is less affected by outliers because outliers have a smaller effect on the median than they do on the mean.
The term median absolute deviation refers to a statistic calculated from a sample. However, it can be used to estimate the population parameter.
MAD Example
Example: Find the MAD of the following set of numbers: 3, 8, 8, 8, 8, 9, 9, 9, 9.
Step 1: Find the median. The median for this set of numbers is 8.
Step 2: Subtract the median from each x-value using the formula |yi – median|.
|3 – 8| = 5
|8 – 8| = 0
|8 – 8| = 0
|8 – 8| = 0
|8 – 8| = 0
|9 – 8| = 1
|9 – 8| = 1
|9 – 8| = 1
|9 – 8| = 1
Step 3: find the median of the absolute differences. The median of the differences (0,0,0,0,1,1,1,1,5) is 1.
How the MAD Performs for Different Distributions
The following image (from NIST.gov) shows histograms for 10,000 random numbers drawn from four different distributions: a normal distribution, double exponential distribution, Cauchy distribution and Tukey-Lambda distribution.
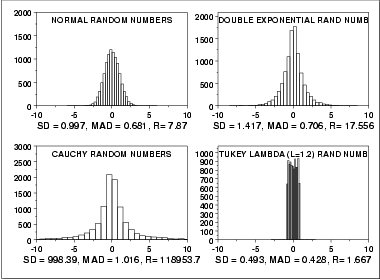
- Normal: the MAD is slightly less than the standard deviation(SD) as it downw-eights the tails. This is one reason not to use the MAD for normal distributions.
- Double exponential: The SD is usually too large while the MAD is about the same as it would be for the normal.
- Cauchy: the SD is very large, while the MAD is on;y just a little larger than normal.
- Tukey-Lambda Distribution: this distribution has truncated (cut off) tails; the SD and MAD are about the same.
Robustness Notes
As stated above, the median absolute deviation is a robust statistic, even for data drawn from non normal populations. However, robustness can mean two different things:
- Robustness of Validity: confidence intervals for the measure of variation (spread) are 95% for any distribution.
- Robustness of Efficiency: confidence intervals hold true for non normal tails.
While the MAD does have robustness of validity, it is affected by non normal tails, and so doesn’t have robustness of efficiency.