Descriptive Statistics > Measures of Spread
What are Measures of Spread?
Measures of spread (also called measures of dispersion) tell you something about how wide the set of data is. There are several basic measures of spread used in statistics. The most common are:
- The range (including the interquartile range and the interdecile range),
- The standard deviation,
- The variance,
- Quartiles.
1. The Range

The range is a basic statistic that tells you the range of values. For example, if your minimum value is $10 and the maximum value is $100 then the range is $90 ($100 – $10). A similar statistic is the interquartile range, which tells you the range in the middle fifty percent of a set of data; in other words, it’s where the bulk of data tends to lie.
See: The Range and Interquartile Range for examples and calculation steps.
Another, less common measure is the Semi Interquartile Range, which is one half of the interquartile range.
2. Standard Deviation
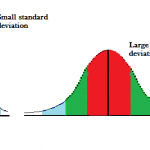
 Simply put, the standard deviation is a measure of how spread out data is around center of the distribution (the mean). It also gives you an idea of where, percentage wise, a certain value falls. For example, let’s say you took a test and it was normally distributed (shaped like a bell). You score one standard deviation above the mean. That tells you your score puts you in the top 84% of test takers.
See: Standard Deviation for examples and calculation steps.
3. The Variance
The variance is a very simple statistic that gives you an extremely rough idea of how spread out a data set is. As a measure of spread, it’s actually pretty weak. A large variance of 22,000, for example, doesn’t tell you much about the spread of data — other than it’s big! The most important reason the variance exists is to give you a way to find the standard deviation: the standard deviation is the square root of variance.
See: Variance for examples and calculation steps.
4. Quartiles

See: Quartiles for a more in depth definition and calculation steps.
References
Gonick, L. The Cartoon Guide to Statistics, HarperPerennial. 1993