Bias > Measurement Error
What is Measurement Error?
Measurement Error (also called Observational Error) is the difference between a measured quantity and its true value. It includes random error (naturally occurring errors that are to be expected with any experiment) and systematic error (caused by a mis-calibrated instrument that affects all measurements).
For example, let’s say you were measuring the weights of 100 marathon athletes. The scale you use is one pound off: this is a systematic error that will result in all athletes body weight calculations to be off by a pound. On the other hand, let’s say your scale was accurate. Some athletes might be more dehydrated than others. Some might have wetter (and therefore heavier) clothing or a 2 oz. candy bar in a pocket. These are random errors and are to be expected. In fact, all collected samples will have random errors — they are, for the most part, unavoidable.
Measurement errors can quickly grow in size when used in formulas. For example, if you’re using a small error in a velocity measurement to calculate kinetic energy, your errors can easily quadruple. To account for this, you should use a formula for error propagation whenever you use uncertain measures in an experiment to calculate something else.
Different Measures of Error
Different measures of error include:
- Absolute Error: the amount of error in your measurement. For example, if you step on a scale and it says 150 pounds but you know your true weight is 145 pounds, then the scale has an absolute error of 150 lbs – 145 lbs = 5 lbs.
- Greatest Possible Error: defined as one half of the measuring unit. For example, if you use a ruler that measures in whole yards (i.e. without any fractions), then the greatest possible error is one half yard.
- Instrument Error: error caused by an inaccurate instrument (like a scale that is off or a poorly worded questionnaire).
- Margin of Error: an amount above and below your measurement. For example, you might say that the average baby weighs 8 pounds with a margin of error of 2 pounds (± 2 lbs).
- Measurement Location Error: caused by an instrument being placed somewhere it shouldn’t, like a thermometer left out in the full sun.
- Operator Error: human factors that cause error, like reading a scale incorrectly.
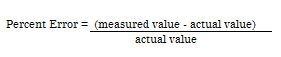
- Percent Error: another way of expressing measurement error. Defined as:
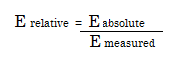
- Relative Error: the ratio of the absolute error to the accepted measurement. As a formula, that’s:
Ways to Reduce Measurement Error
- Double check all measurements for accuracy. For example, double-enter all inputs on two worksheets and compare them.
- Double check your formulas are correct.
- Make sure observers and measurement takers are well trained.
- Make the measurement with the instrument that has the highest precision.
- Take the measurements under controlled conditions.
- Pilot test your measuring instruments. For example, put together a focus group and ask how easy or difficult the questions were to understand.
- Use multiple measures for the same construct. For example, if you are testing for depression, use two different questionnaires.
Statistical Procedures to Assess Measurement Error
The following methods assess “absolute reliability”:
- Standard error of measurement (SEM): estimates how repeated measurements taken on the same instrument are estimated around the true score.
- Coefficient of variation (CV): a measure of the variability of a distribution of repeated scores or measurements. Smaller values indicate a smaller variation and therefore values closer to the true score.
- Limits of agreement (LOA): gives an estimate of the interval where a proportion of the differences lie between measurements.
References
Beyer, W. H. CRC Standard Mathematical Tables, 31st ed. Boca Raton, FL: CRC Press, pp. 536 and 571, 2002.
Dodge, Y. (2008). The Concise Encyclopedia of Statistics. Springer.
Vogt, W.P. (2005). Dictionary of Statistics & Methodology: A Nontechnical Guide for the Social Sciences. SAGE.
Wheelan, C. (2014). Naked Statistics. W. W. Norton & Company